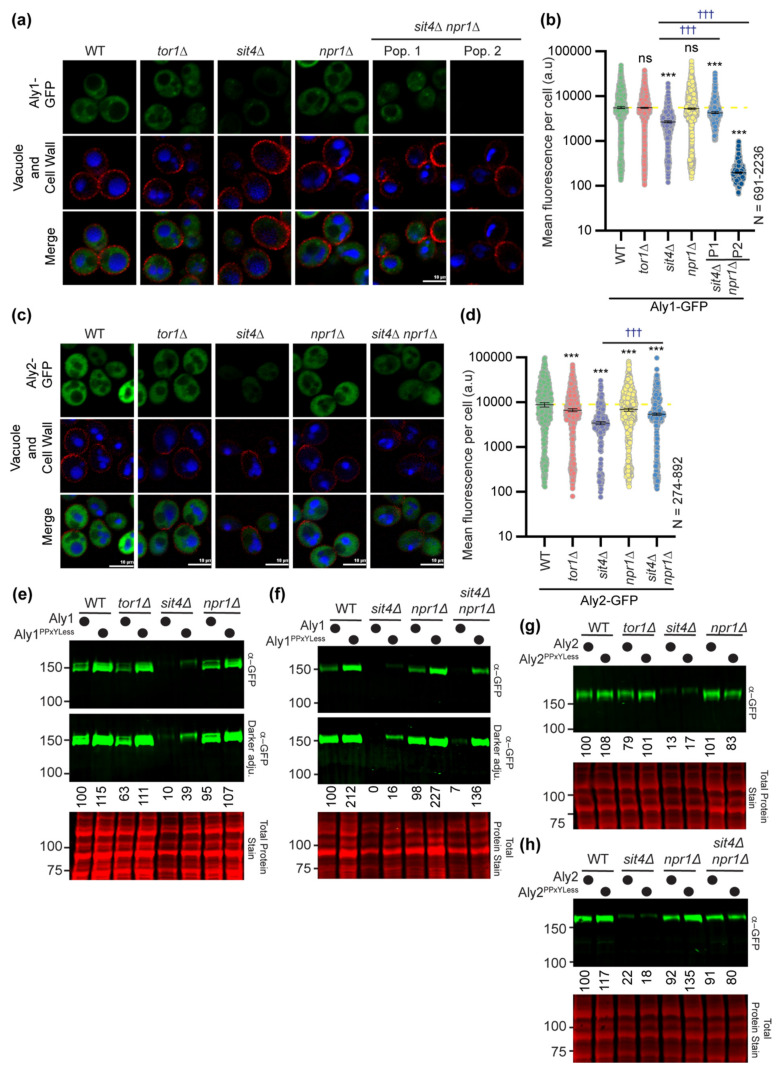
Figure 6.
Sit4 and Npr1 regulate Aly abundance but do not affect localization: (a) Aly1-GFP or (c) Aly2-GFP was expressed from the TEF1pr in either WT cells or those lacking the gene indicated and imaged by high-content fluorescence microscopy. CMAC is used to stain the vacuoles (shown in blue) and trypan blue (shown in red) is used to mark the cell wall. All images are shown as equally adjusted from a single experiment. (b) or (d) The whole-cell fluorescence of cells imaged in (a) or (c), respectively, was determined using NIS.ai and Nikon GA3 software, and the fluorescence for each cell is plotted as a circle. The median fluorescence intensity is shown as a black line for each group and the error bars represent the 95% confidence interval. A yellow dashed line represents the median fluorescence intensity for Aly1 or Aly2, expressed in WT cells in panels b and d, respectively. Kruskal–Wallis statistical analysis with Dunn’s post hoc test was performed to compare the fluorescence distributions to the cognate WT. In black asterisks (*), statistical comparisons are made to Aly1 or Aly2 in WT cells for panels (b) and (d), respectively. In blue daggers (†), the indicated statistical comparisons are made (ns = not significant; three symbols = p-value < 0.0005). (e–h) Whole-cell extracts were made from the indicated strains expressing Alys as GFP-tagged proteins from the TEF1pr and then resolved by SDS-PAGE. Immunoblots were probed with anti-GFP antibody to examine Aly abundance and mobility. REVERT total protein stain is shown for each blot as a loading control (red). The percent of Aly protein, corrected for the loading control, for each lane is calculated relative to WT Aly in WT cells.

