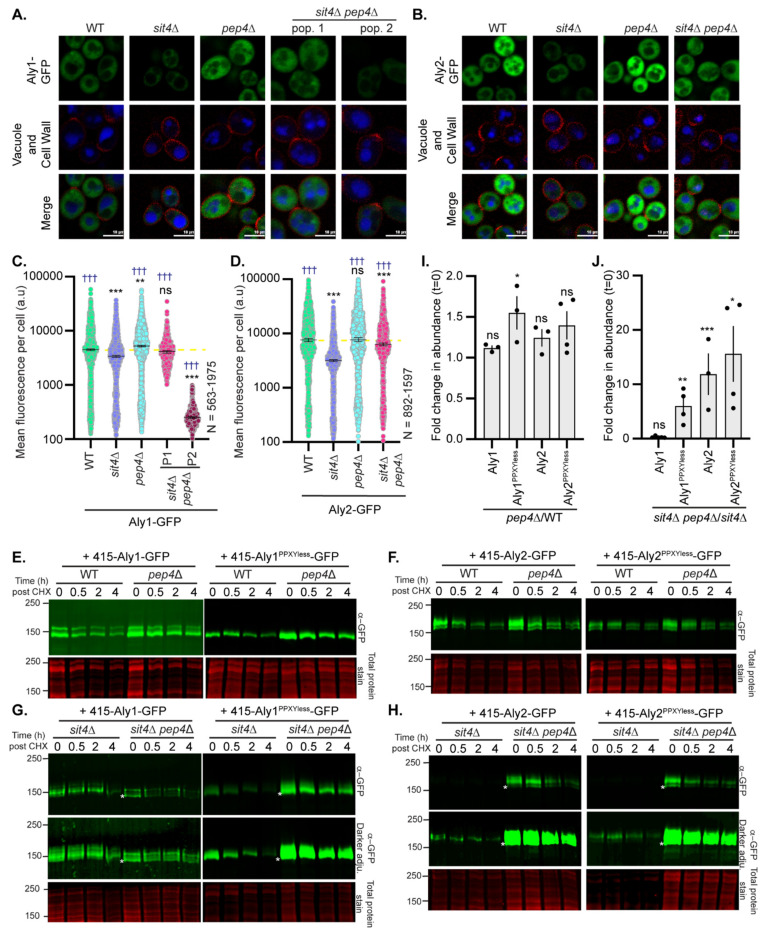
Figure 9.
Impaired vacuole protease function increases Aly protein abundance: (A) Aly1-GFP or (B) Aly2-GFP was expressed from the TEF1pr in either WT cells or those lacking the gene indicated and imaged by high-content fluorescence microscopy. CMAC is used to stain the vacuoles (shown in blue), and trypan blue (shown in red) is used to mark the cell wall. (C) or (D) The whole-cell fluorescence of cells imaged in (A) or (B), respectively, was determined using NIS.ai software, and the fluorescence for each cell is plotted as a circle. The median fluorescence intensity is shown as a black line for each group, and the error bars represent the 95% confidence interval. A yellow dashed line represents the median fluorescence intensity for Aly1 or Aly2, expressed in WT cells in panels (G) and (H), respectively. Kruskal–Wallis statistical analysis with Dunn’s post hoc test was performed to compare the fluorescence distributions to the cognate WT. In black asterisks (*), statistical comparisons are made to Aly1 or Aly2 in WT cells for panels (C,D), respectively. In blue daggers (†), statistical comparisons are made to Aly1 or Aly2 in sit4∆ cells for panels (C,D), respectively (ns = not significant; two symbols = p-value < 0.005; three symbols = p-value < 0.0005). (E–H) Whole-cell extracts expressing the α-arrestin indicated in WT, pep4∆, sit4∆, or sit4∆ pep4∆ cells were made from cells treated with cycloheximide (CHX) for the time indicated (hours) and resolved by SDS-PAGE. Anti-GFP antibody was used to detect tagged α-arrestins and REVERT total protein stain was used as a loading control. Blots shown are one representative from 2–3 replicate experiments. Molecular weights are shown on the left side in kDa. For panels (G,H), a white asterisk marks the faster migrating species observed in the sit4∆ pep4∆ extracts that are not found in the sit4∆ alone. (I,J) A plot of the fold change in the t = 0 absolute pixel intensities for the Aly-GFP bands shown in (E,F) or (G,H), respectively, is presented so that the influence of Pep4 on steady-state Aly abundances can be considered relative to WT (E,F,I) or sit4∆ (G,H,J) cells. Each fold change data point is presented as a circle, and the mean is represented by the height of the bar graph. Error bars represent the SEM. Student’s t-test with Welch’s correction was performed on the pixel intensity values for each (i.e., comparing Aly1 t = 0 band intensities for WT vs. pep4∆), and results are presented over each column. ns = not significant; * = p < 0.05; ** = p < 0.005; *** = p-value < 0.0005).

