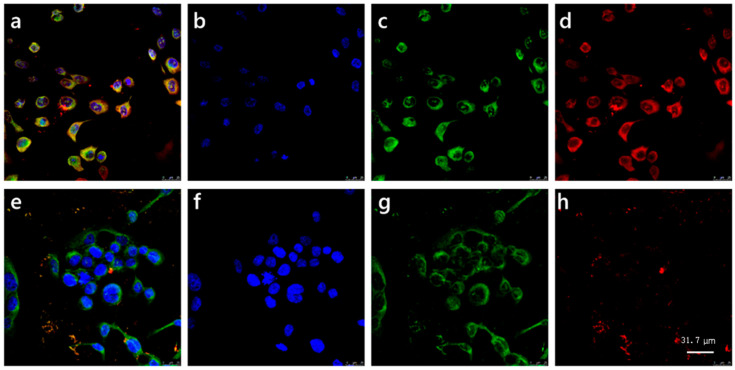
Figure 2.
Immunolocalization of PLTX in HaCaT cells. Cells were exposed to 2 × 10⁻⁸ M PLTX. PLTX is shown in red by 5′-Cy5-labeled aptamer (red fluorescence). The nuclei are shown in blue by DAPI (blue fluorescence). The cell membrane is shown in green by DiO (green fluorescence). A 63× magnification objective was used. Scale bar: 31.7 µm. The top panel was treated with specific aptamer to show the subcellular distribution of PLTX. The bottom panel shows controls with random aptamer. (a,e) Co-localization of the nucleus, cell membrane and PLTX. (b,f) The nucleus only. (c,g) The cell membrane only. (d,h) Distribution of PLTX labeled by different aptamers in cells: PLTX-specific aptamer (d) and random aptamer (h). Representative images of three independent experiments are presented.

