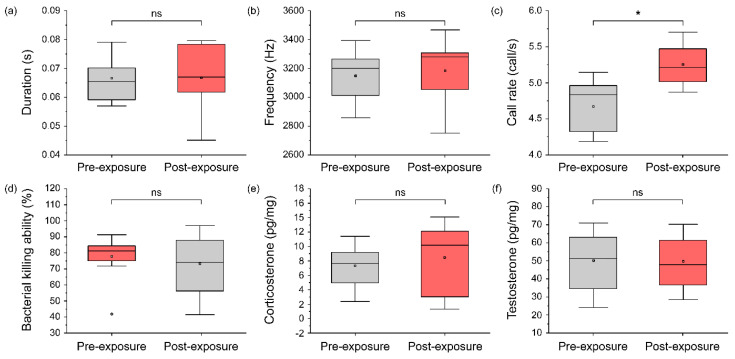
Figure 6.
The change in calling pattern, immunity, and physiological conditions due to exposure to wind turbine noise: (a) note duration, (b) dominant frequency, (c) call rate, (d) bacterial killing ability, (e) corticosterone, and (f) testosterone. The gray boxes represent pre-exposure conditions, and the red boxes represent post-exposure conditions. Significant differences (p < 0.05) were determined using a paired t-test (and Wilcoxon rank–sum test in immunity graph) and are represented by asterisks (*).

