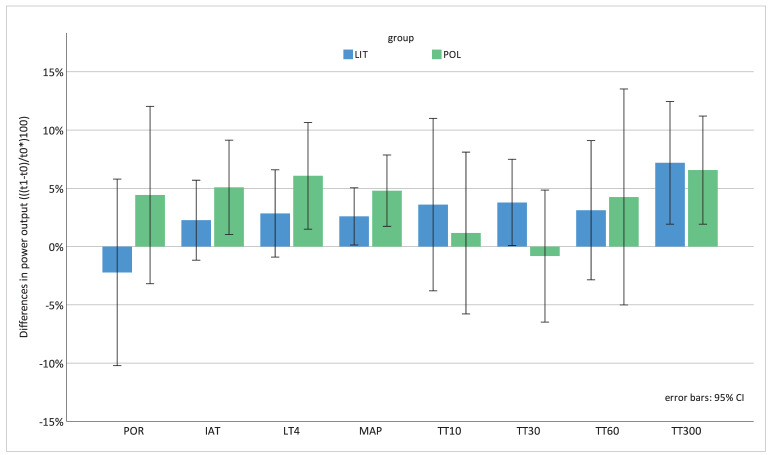
Figure 3.
Changes in cycling power output: normalised differences in power output (t1 − t0) (watts in %). Differences are expressed as a percentage of the respective measurement value ((t1 − t0)/t0)*100); error bars: 95% CI; LIT = low-intensity training; POL = polarized training; POR: mean power output during the race; IAT: individual anaerobic threshold; LT4: 4 mmol lactate threshold; MAP: maximal aerobic power; TT10–300: time trials (sprint/maximal effort) lasting 10 to 300 s.

