Figure 5.
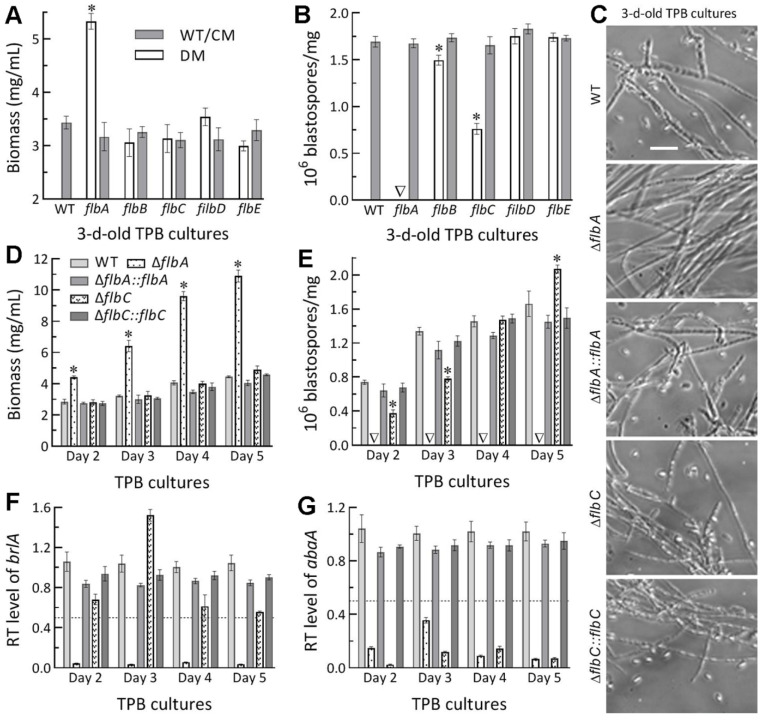
Submerged blastospore production of Δflb mutants (DM) and their control (WT and CM) strains in B. bassiana. (A,B) Biomass levels and dimorphic transition rates measured from the 3 d-old TPB cultures grown at 25 °C, respectively. (C) Microscopic images (scale: 20 μm) for a status of blastospore production in the 3 d-old cultures of a 106 conidia/mL TPB mimicking insect hemolymph. (D,E) Time-course biomass levels and dimorphic transition rates in the TPB cultures incubated at 25 °C for 2–5 d on a shaking bed. (F,G) Relative transcript (RT) levels of the key CDP genes brlA and abaA in the TPB cultures of mutants with respect to the WT standard during the 5-d incubation. The dashed line denotes a significant level of one-fold (50%) downregulation. * p < 0.05 (A,B,D,E) in Tukey’s HSD tests. Error bars: SDs of the means from three independent replicates.

