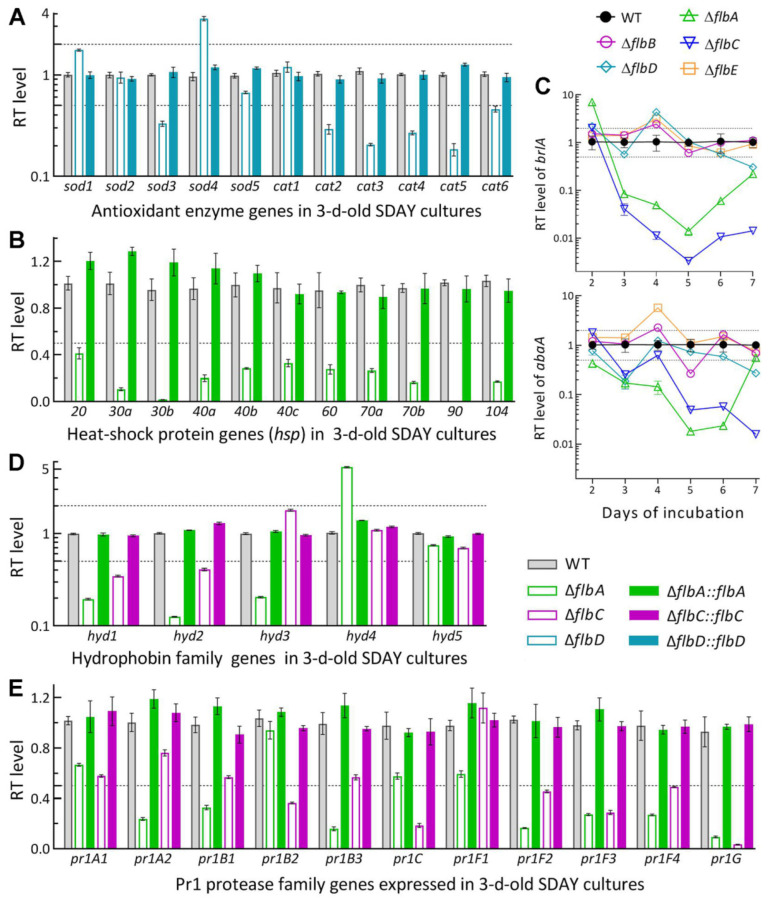
Figure 6.
Relative transcript (RT) levels of clustered genes associated with phenotypes of the flb mutants with respect to the WT standard in B. bassiana. The tested cDNA samples were derived from the SDAY cultures initiated by spreading 100 μL aliquots of a 107 conidia/mL suspension and incubated for 3 d (A,B,D,E) or 2–7 d (C) at the optimal regime of 25 °C and L:D 12:12. The lower and/or upper dashed lines denote significant levels of one-fold down- and upregulation, respectively. Error bars: SDs of the means from three independent cDNA samples examined by qPCR analysis.

