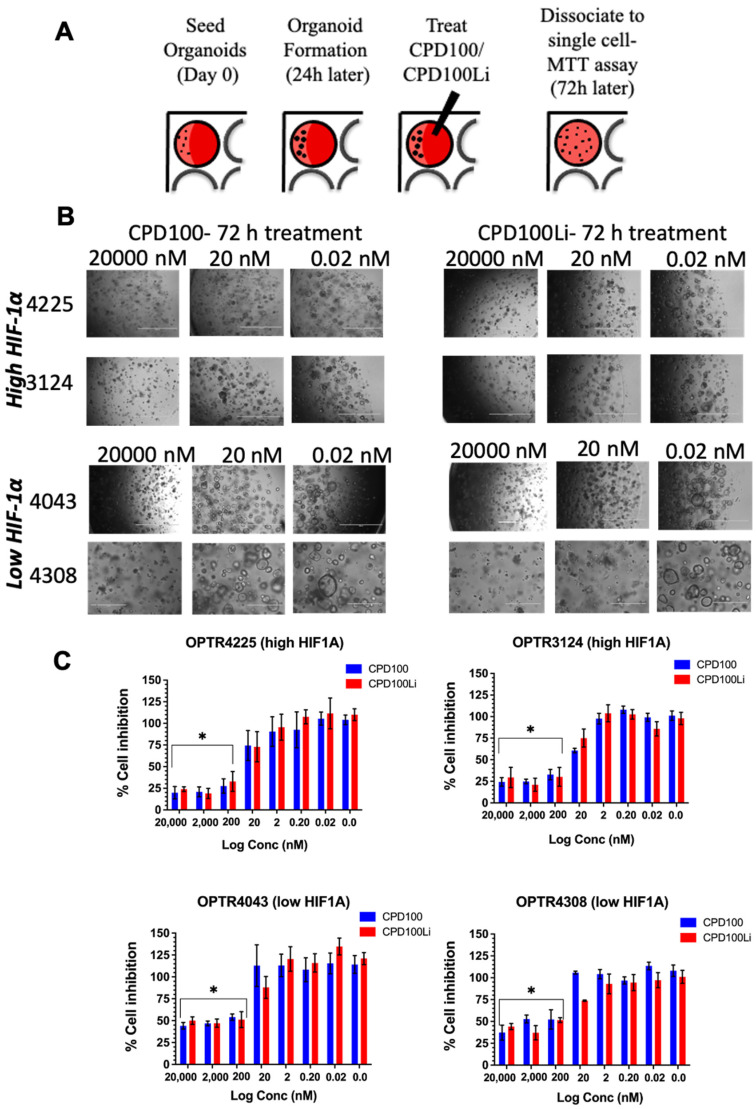
Figure 3.
In vitro efficacy of CPD100 and CPD100Li in patient-derived organoids. Schematics of organoid development and treatment (A), bright-field images of two high and low HIF1A expressing organoids as a function of three concentrations after 72-h treatment with CPD100 and CPD100Li, scale bar represents 1000 µm (B), and % cell inhibition as a function of CPD100 and CPD100Li 72-h post-treatment (C). Data represented as mean ± SD of four replicates. * (p ≤ 0.05) represents statistical significance compared to the 0.02 nM treated group by the Student-paired t-test.

