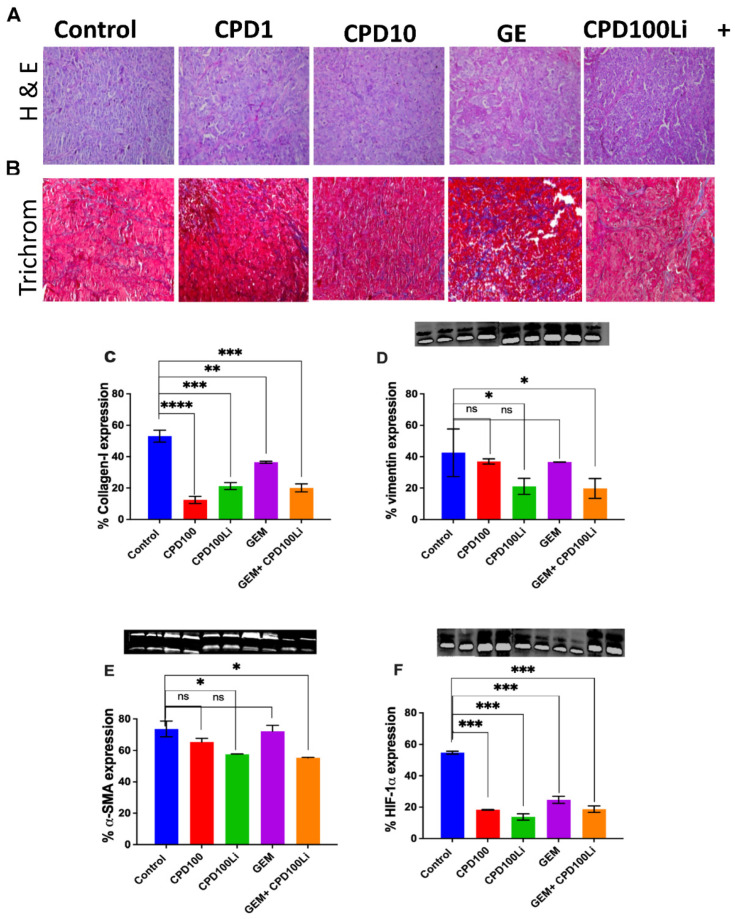
Figure 5.
H&E-trichrome stains and immunoblots. Representative (A), H&E and (B), Masson’s trichrome stain of tumors from the treatment groups: control, CPD100, CPD100Li, GEM, CPD100Li + GEM, scale bar represents 200 µm (C), % collagen quantified in trichrome stain using ImageJ and immunoblots of (D), % vimentin expression (E), % α-SMA expression and (F), % HIF1A expression. Error bars are standard deviations. ns (p > 0.05), * (p ≤ 0.05), ** (p ≤ 0.01), *** (p ≤ 0.001), and **** (p ≤ 0.0001) represent the statistical significance compared to control group by one-way ANOVA.

