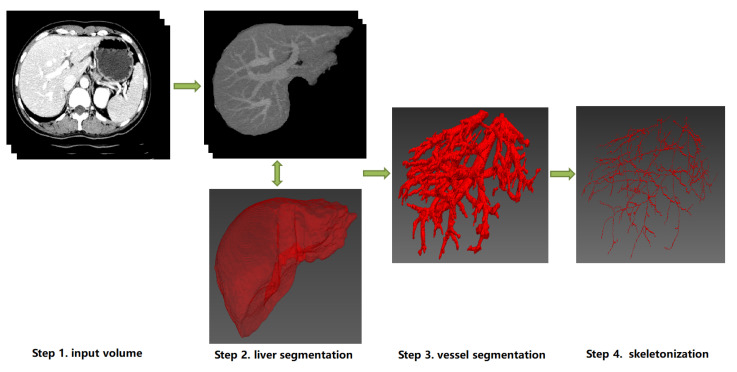
Figure 5.
The schematic diagram of a uniform pipeline of hepatic vessel skeletonization. It represents two classes of skeletonization approaches (Category A and B). Category A: from Step 1 to Step 4, the datailed skeletonization methods executed between Step 3 and Step 4. Category B: Step 3 will be skipped, and the skeletonization outputs can be directly computed from the image data of Step 1 or Step 2. Note that the 3D visualization of Step 2, Step 3 and Step 4 can be implemented by ITK [69], VTK [70] and MITK [71].

