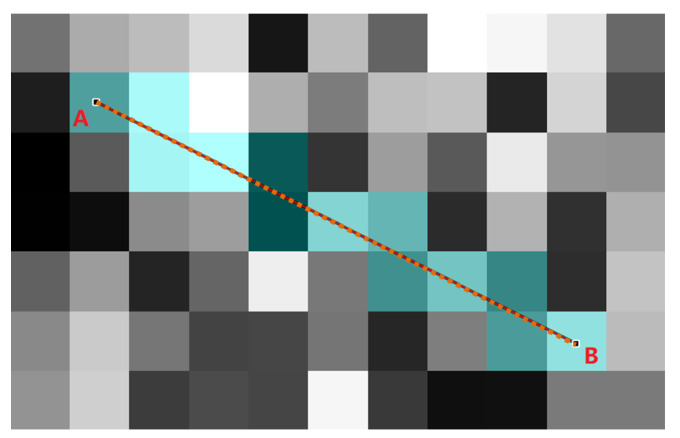
Figure 7.
Illustration of the computation of cost function. Line represents the arbitrary edge E of random tree G. The orange points lying on are acquired through subdivision interpolation, for which its total number is N. The pixel values of orange points are determined by the located cyan pixel blocks.

