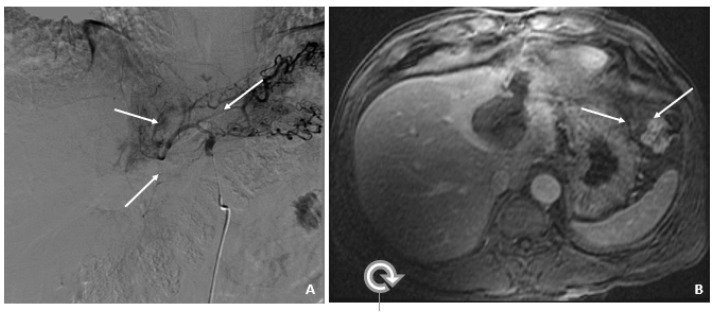
Figure 2.
Transarterial Chemoembolization (December 2009). (A) The selective left hepatic artery injection shows a blush of contrast corresponding to the hypervascular tumor (arrows). (B) An axial T1-weighted fat-suppressed portal-phase postcontrast MRI image 4 weeks following TACE shows lack of enhancement in the treated lesion with a small adjacent focus of necrosis (arrows).

