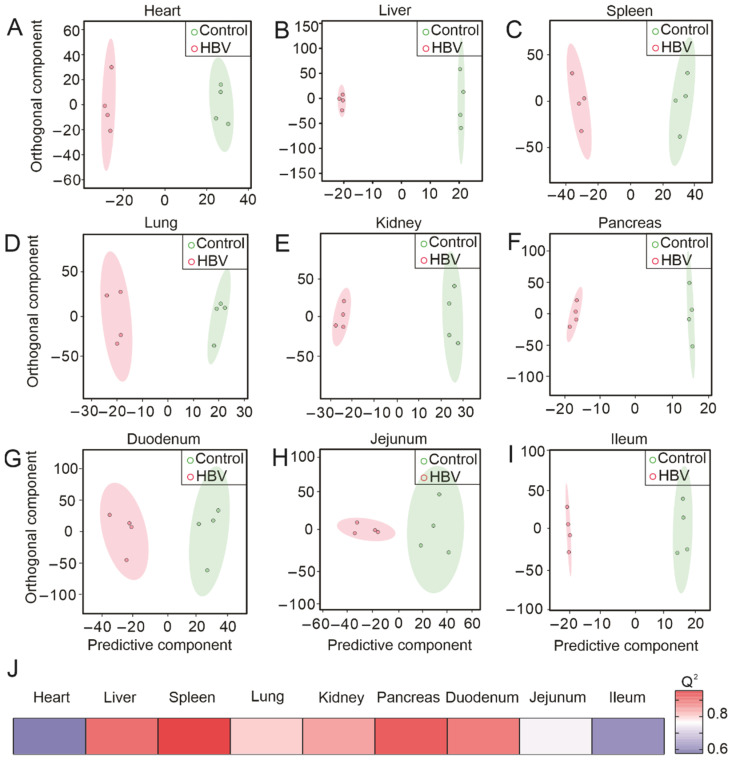
Figure 1.
Multivariate analysis of 1H NMR spectroscopic data revealed significant differences in tissues metabolic profiles between HBV-transgenic and control mice. (A–I) represents the O-PLS-DA plot of the heart, liver, spleen, lung, kidney, pancreas, duodenum, jejunum, and ileum, respectively. (J) Heatmap showing O-PLS-DA-derived Q2 for pairwise comparisons of the different organs samples.

