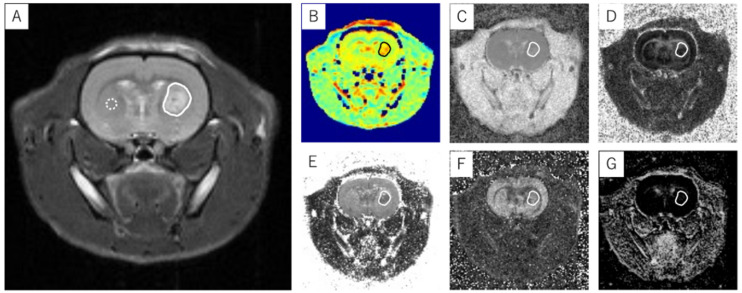
Figure 2.
An example of ROI placement in a glioblastoma model. An ROI that covered the entire tumor was placed at the T2WI slice position (A) where the brain tumor was most widely observed. The ROI was replicated in APT imaging (B) and ADC (C), FA (D), ICVF (E), ODI (F), and ISO maps (G) at the same slice position as the T2WI, and each measurement was performed. The T2 signal intensity ratio was calculated as the ratio of the average signal value in the solid line ROI to the average signal value in the dotted line ROI. Solid line ROI: transplanted tumor; dotted line ROI: contralateral normal brain tissue.

