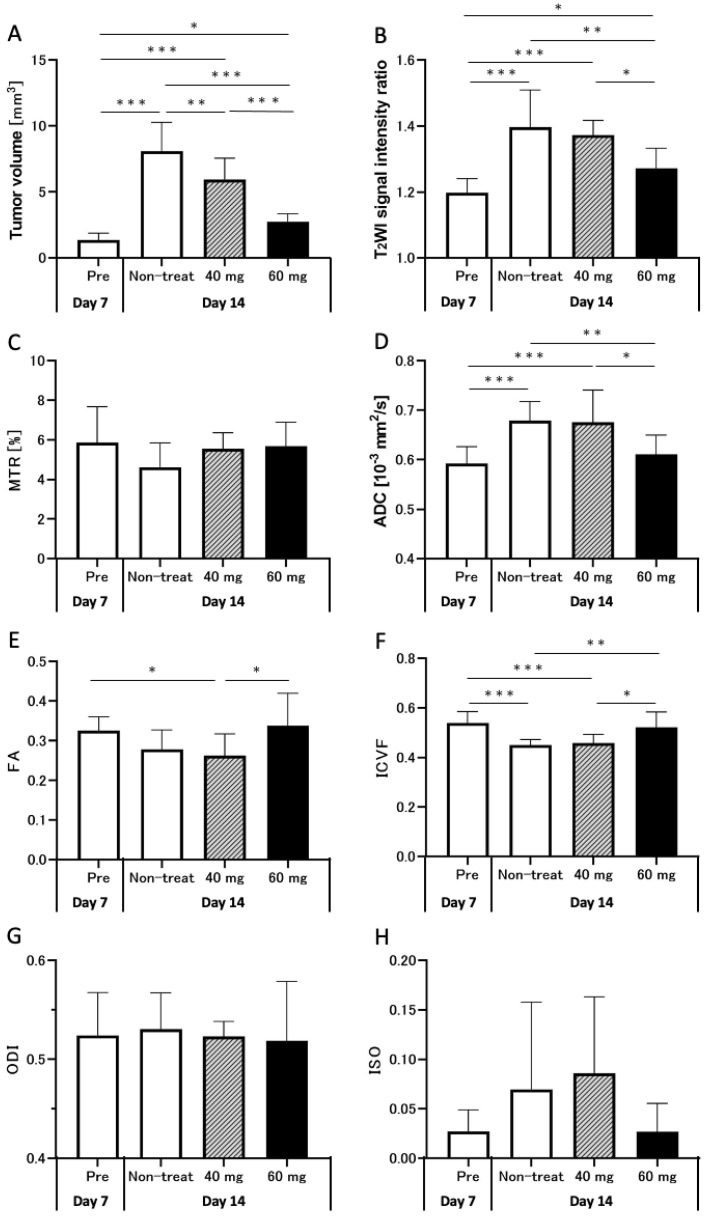
Figure 3.
Graphs quantifying the tumor volume (A), T2WI signal intensity ratio (B), MTR (C), ADC (D), FA (E), ICVF (F), ODI (G), and ISO (H) in pre-treatment group on day 7 (white bars, n = 25) and non-treatment (white bars, n = 10), TMZ-40 mg (gray bars with diagonal lines, n = 7), and TMZ-60 mg (black bars, n = 8) groups on day 14 after transplantation. *: p < 0.05; **: p < 0.01; ***: p < 0.001; 40 mg, TMZ-40 mg; 60 mg, TMZ-60 mg; MTR, magnetization transfer ratio; ADC, apparent diffusion coefficient; FA, fractional anisotropy; ICVF, intracellular volume fraction; ODI, orientation dispersion index; ISO, isotropic volume fraction.

