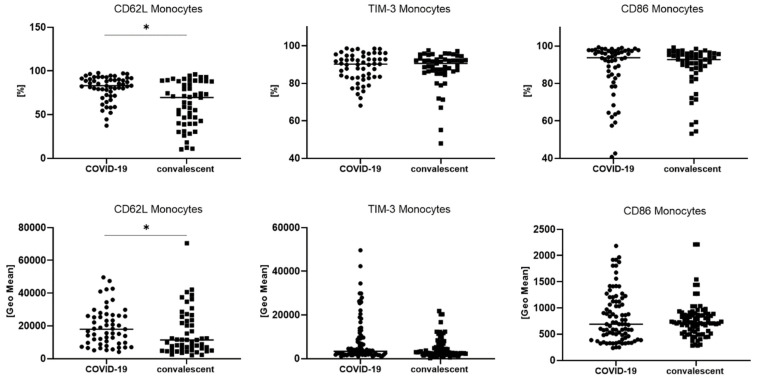
Figure 5.
The differences between COVID-19 and convalescent patients for geometric mean expression of CD62L, TIM-3 and CD86 on monocytes. Graphs show the median values (Min–Max). Significant differences in the cell proportion between COVID-19 and convalescent patients in the Mann–Whitney U test presented as * (p < 0.05).

