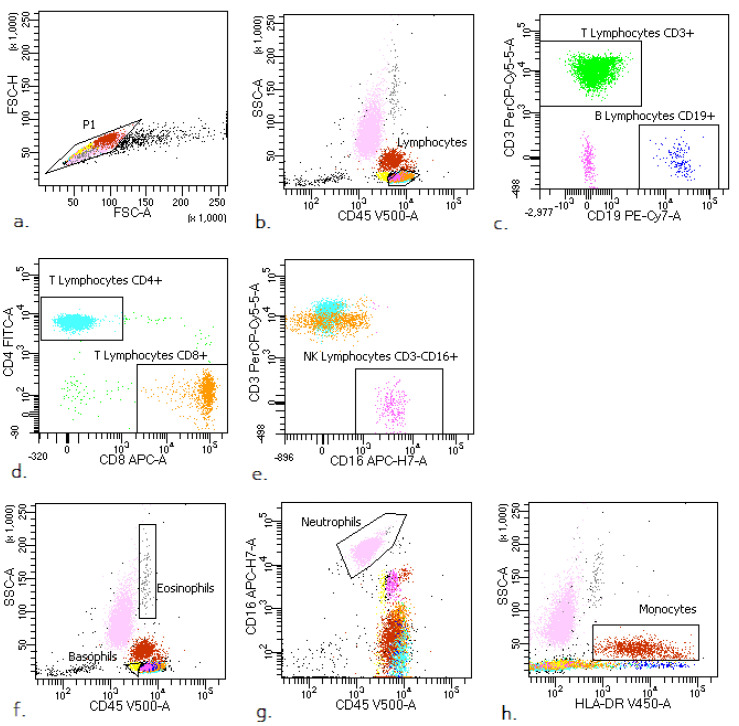
Figure A1.
Representative leukocyte subsets’ gating strategy in peripheral blood (PB) of COVID-19 patients. (a) FSC-A vs. FSC-H plot: gating the cells that have an equal area and height (P1), thus removing clumps (greater FSC-A relative to FSC-H) and debris (very low FSC). (b) SSC-A vs. CD45 plot: selection of lymphocytes based on their SSClow/CD45+ properties. (c) CD3 vs. CD19 plot: selection of T lymphocytes (green) and B lymphocytes (blue) based on their CD3+ or CD19+ properties. (d) CD4 vs. CD8 plot: selection of CD4 (turquoise) and CD8+ cells (orange) based on their CD4+ or CD8+ properties. (e) CD3 vs. CD16 plot: selection of NK cells (pink) based on their CD16+ and CD3− properties. (f) SSC-A vs. CD45 plot: selection of eosinophils (grey) based on their SSC-A+bright CD45+ properties. (g) CD16 vs. CD45 plot: selection of neutrophils (light pink) based on their CD45+dim CD16+bright properties. (h) SSC-A vs. HLA-DR plot: selection of monocytes (red) based on their SSC-A+dim HLA-DR+ properties (the exact antigenic characterization can be found in the text in Section 2, Flow cytometry analysis).

