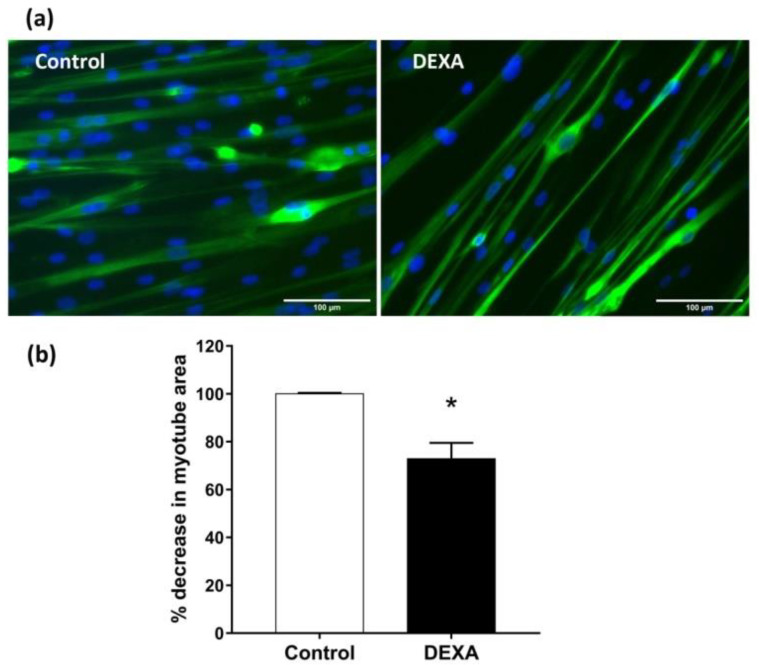
Figure 5.
Induction of atrophy in HSMM myotubes. (a) Differentiated myotubes were treated with 50 µM of DEXA for 48 h. Representative images of MYH2/Hoechst-labeled myotube (green/blu). (b) Plots of the percent decrease, from untreated cells, in myotube area, are shown. Plots represent means ± SEM, n = 10. * p < 0.05 vs. untreated cells (control) using Student’s t-test. (Images at ×20 magnification; scale bar = 100 microns).

