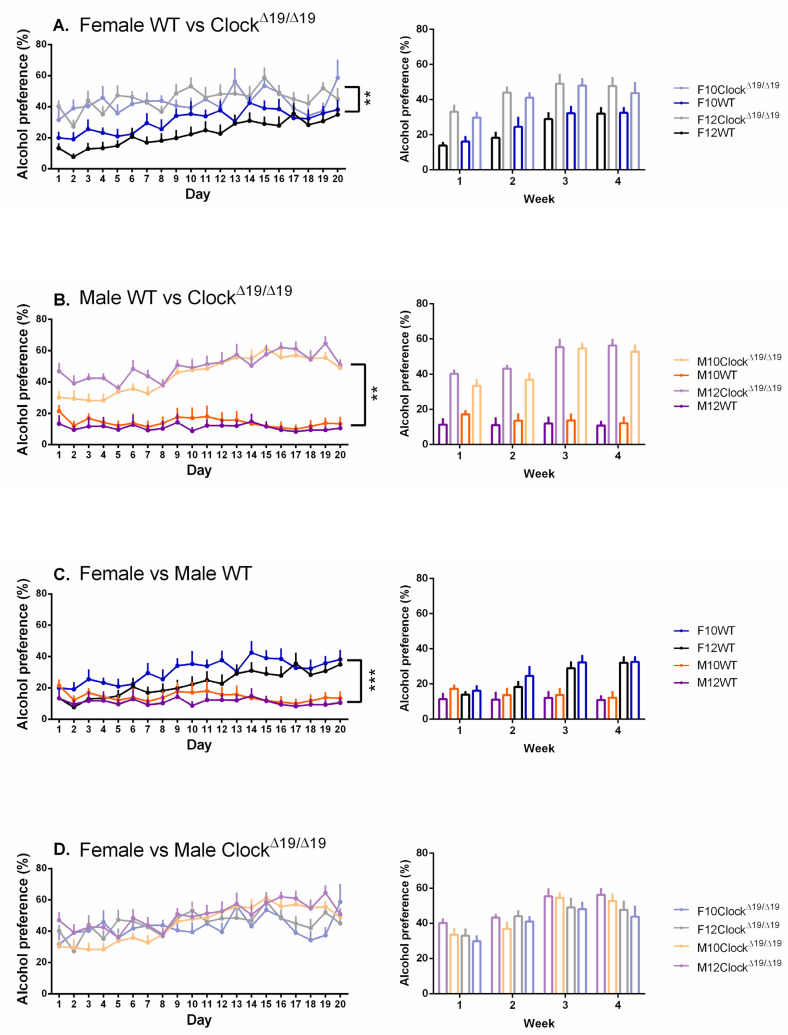
Figure 3.
Alcohol preference in mice is influenced by sex, genotype, and number of drinking days, but not L:D cycle. (A). Compared to female WT mice, female ClockΔ19/Δ19 mice demonstrated enhanced alcohol preference. Over time, female WT alcohol preference increased such that by day 20 they were no longer different from their ClockΔ19/Δ19 counterparts. (B). Male ClockΔ19/Δ19 mice demonstrated enhanced alcohol preference compared to male WT mice, a difference that was maintained across the 20-day testing period. (C). Compared to male WT mice, female WT mice demonstrated alcohol preferences that increased over time such that by day 20 the difference between male and female mice was statistically significant. (D). ClockΔ19/Δ19 mice exhibited alcohol preferences that were not influenced by sex or L:D cycle. F = females, M = males; 12 = 12:12 L:D cycle, 10 = 10:10 L:D cycle; WT = wild-type. Darker tones are WT mice and lighter tones are ClockΔ19/Δ19 mice. Black = female 12:12 L:D group, blue = female 10:10 L:D group, purple = male 12:12 L:D group, orange = male 10:10 L:D group. ** = p < 0.01, *** = p < 0.001.

