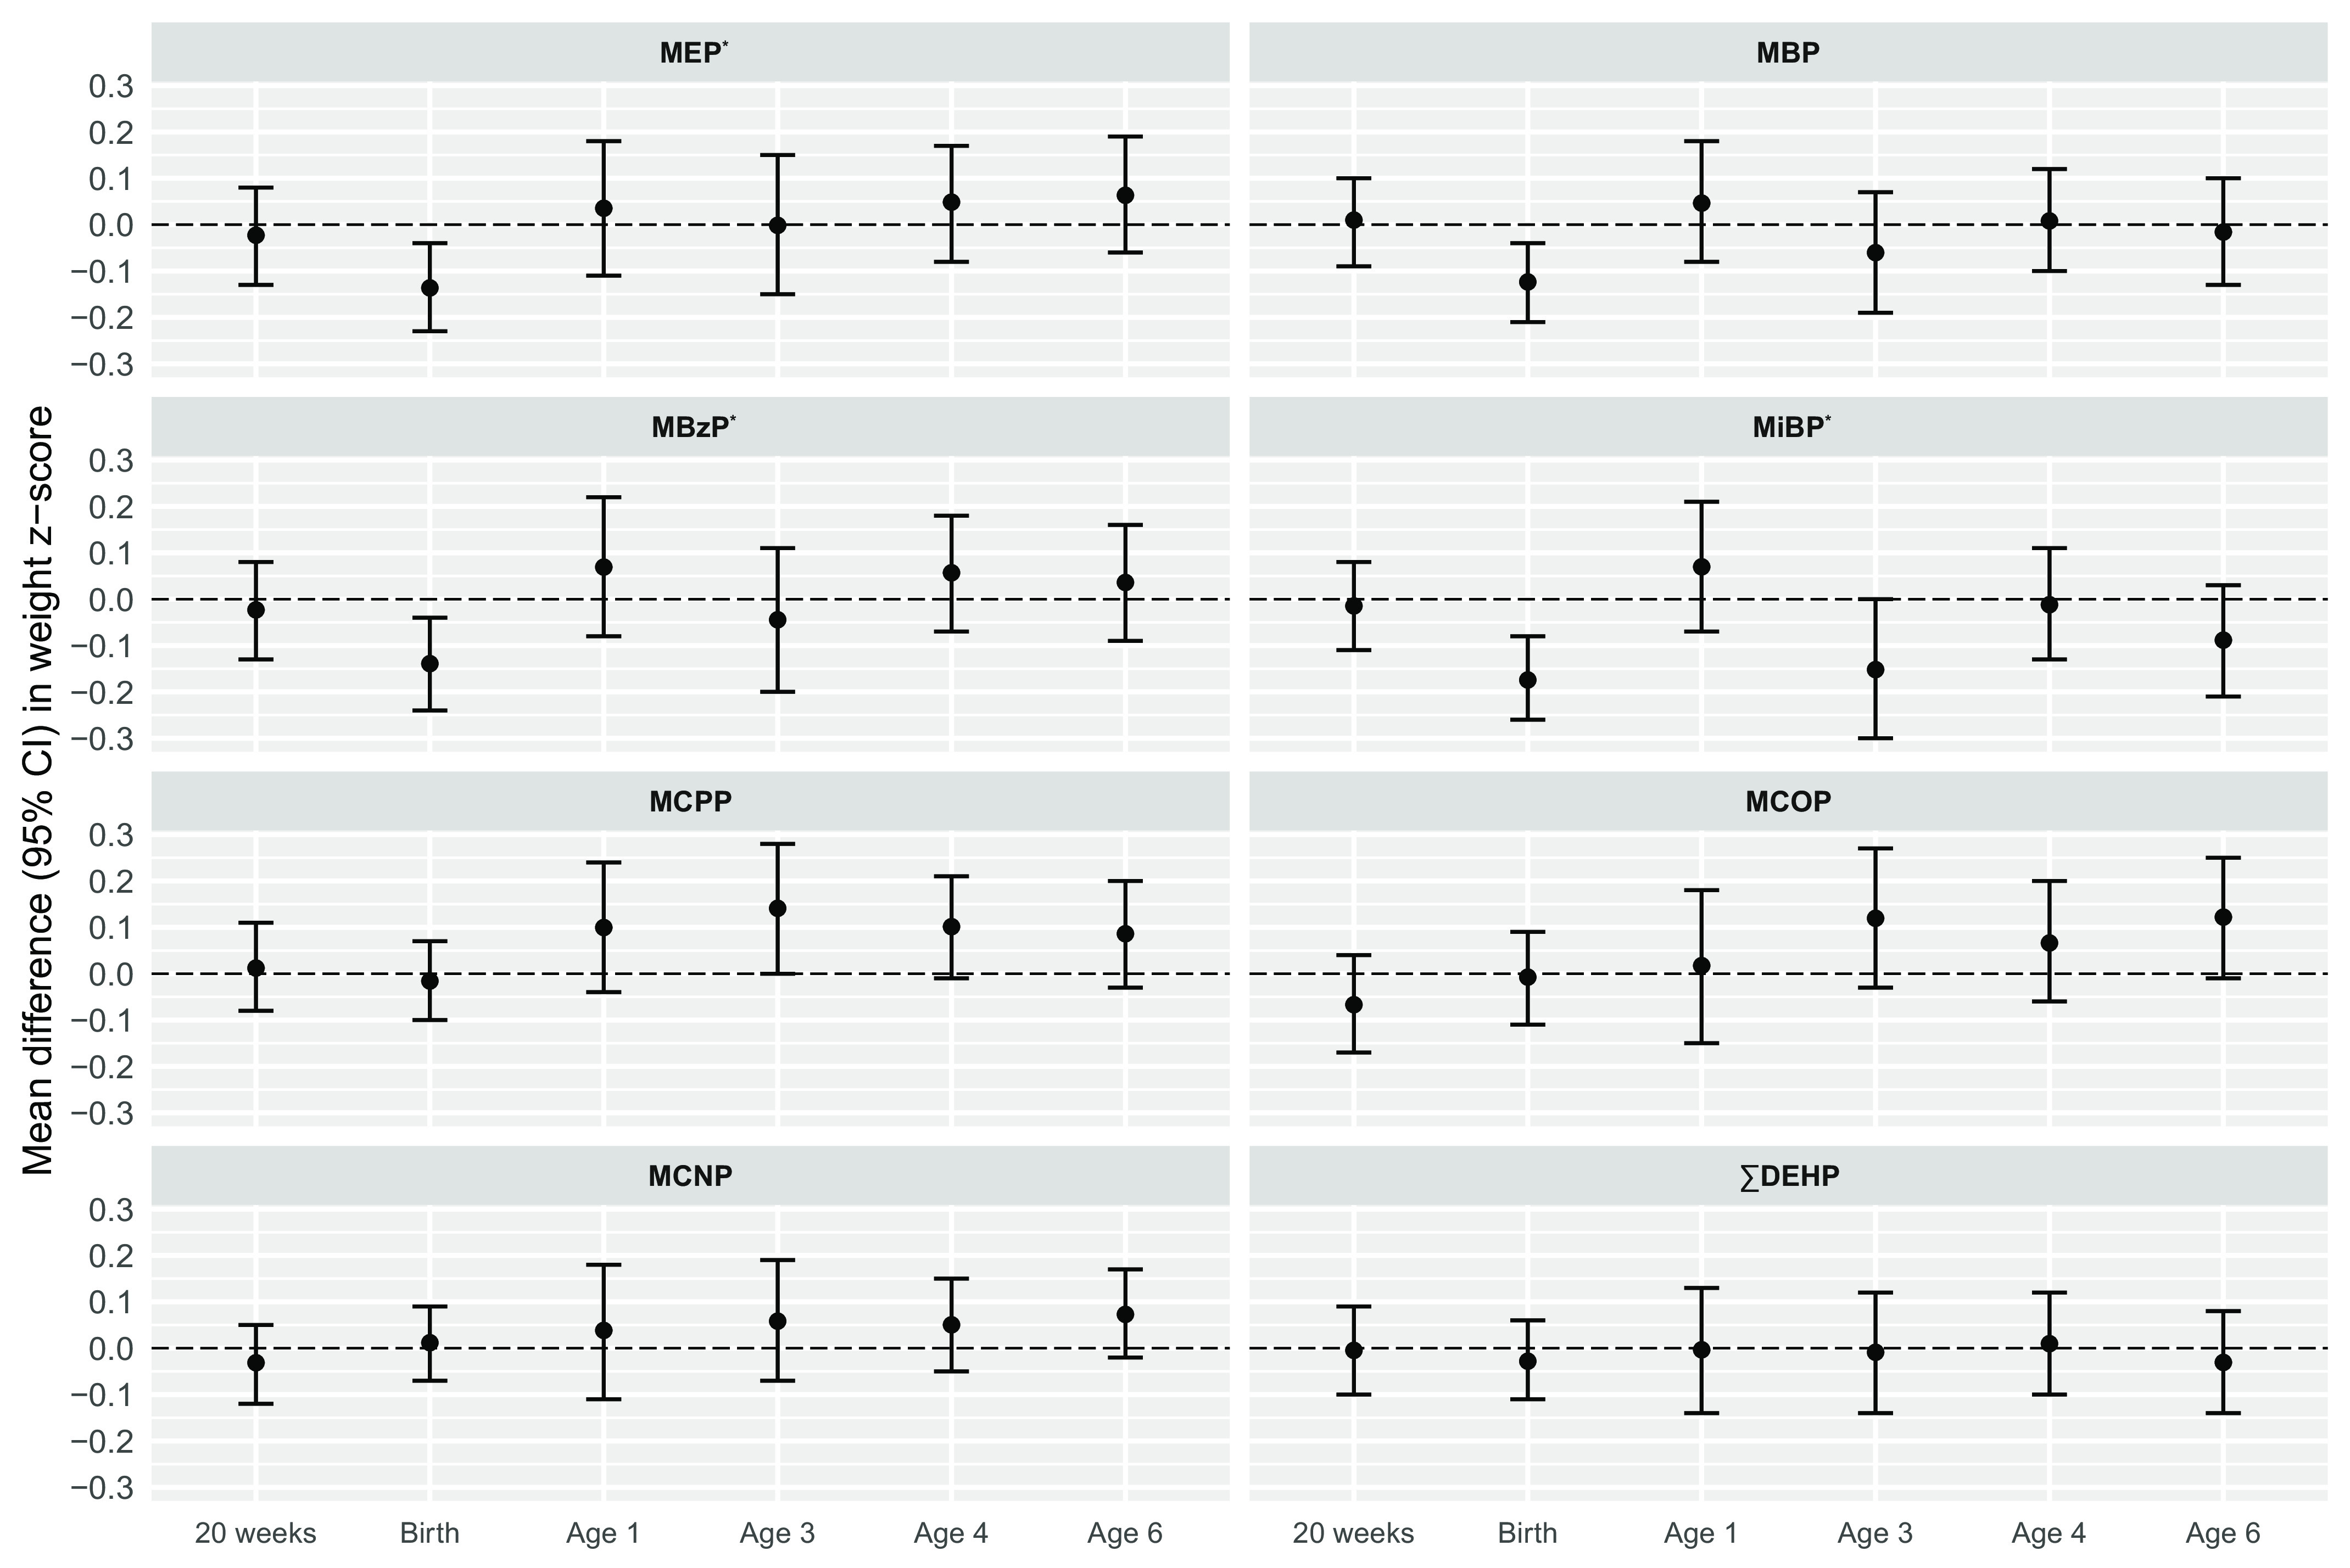
Figure 2.

Adjusted difference in weight -scores (95% CIs) per IQR increase in pregnancy average of individual phthalate metabolite biomarkers (). Effect estimates were calculated using linear mixed-effects models adjusted for maternal age (y), race (White/Black/Other), education level (High school or less/Any technical school or college/Graduate work), prepregnancy BMI (), and study site (UCSF/UMN/URMC/UW). For models of MCOP and MCNP, . No data was collected for females at 1 year of age. *, for overall association of phthalate metabolite on outcome based on likelihood ratio tests. Corresponding effect estimates are presented in Table S4. Note: BMI, body mass index; CI, confidence interval; IQR, interquartile range; MBP, mono--butyl phthalate; MBzP, monobenzyl phthalate; MCNP, monocarboxy-isononyl phthalate; MCOP, monocarboxyoctyl phthalate; MCPP, mono(3-carboxypropyl) phthalate; MEP, mono-ethyl phthalate; MiBP, mono-isobutyl phthalate; , summed di-2-ethylhexyl phthalate; UCSF, University of California, San Francisco; UMN, University of Minnesota; URMC, University of Rochester Medical Center; UW, University of Washington.
