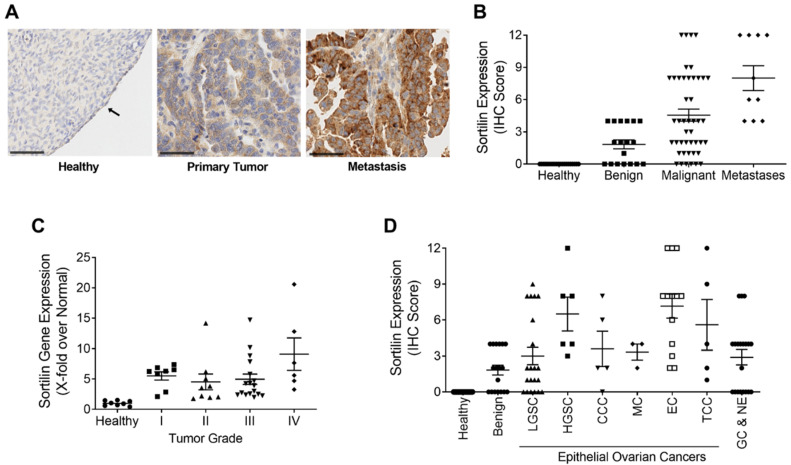
Figure 1.
Expression of SORT1 in ovarian healthy and tumoral tissues. Immunohistochemical staining of SORT1 in tissue microarrays (TMAs) was used to measure the level of SORT1 expression in healthy tissues and in ovarian tumors. With the immunohistochemical (IHC) scoring system used, the level of expressed SORT1 ranged from 0 to a maximum of 12. (A) Representative SORT1 staining by IHC in ovarian healthy, primary and metastases biopsies. Nuclei are stained blue with hematoxylin. Arrows point to ovarian healthy epithelia. Black bars represent 50 µm. (B) IHC scores from healthy tissues (n = 20), benign tumors (n = 18), malignant tumors (n = 45) and metastases (n = 10). (C) RT-qPCR was used to quantify the transcript levels of SORT1 in healthy and cancerous ovarian tissues. The SORT1 transcript levels in tumor samples were segregated according to tumor grade and then compared to the values from healthy ovarian tissues. n = 8 for healthy and for Grade I tumor samples, n = 9 for Grade II, n = 17 for Grade III and n = 7 for Grade IV tumor samples. (D) The mean IHC scores for SORT1 is shown for healthy ovarian tissue (n = 20), benign tumors (n = 18), LGSC (n = 21), HGSC (n = 6), CCC (n = 5), MC (n = 3), EC (n = 13), TCC (n = 5) and GC and NE (n = 20). All scatter plots include lines showing the means ± SEM, and where each point represents an individual tissue sample.

