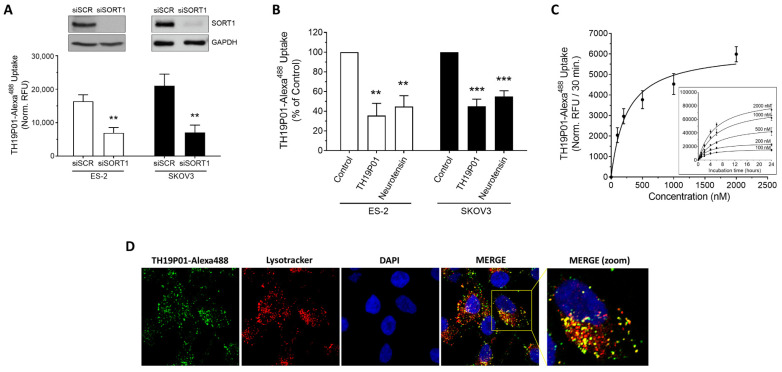
Figure 4.
Internalization of TH19P01-Alexa488 peptide by SORT1 in ovarian cancer cell lines. (A) Uptake of TH19P01-Alexa488 was examined into ES-2 and SKOV3 ovarian cancer cell lines after prior incubation with siRNA, either a scrambled control (siSCR) or siRNA directed against SORT1 (siSORT1). t-tests were used to assess the significance of the difference between fluorescent uptakes (** p < 0.01). Representative SORT1 protein detection by Western blot (n = 3). Data represent the mean of net RFU ± SEM (n = 3 to 4). (B) Uptake of TH19P01-Alexa488 into two ovarian cancer cell lines was measured in the presence of excess concentrations of substrates known to bind to SORT1 (50 µM TH19P01 and 10 µM neurotensin). Fluorescent uptake was compared between cells treated with vehicle (Control) and those treated with the competing ligands using one-way ANOVA and Dunnett’s multiple comparison test (**, p < 0.01; *** p < 0.001). Data represent the percentages to control net RFU mean ± SEM (n = 4) (C) Time-course of TH19P01-Alexa488 uptake in SORT1-positive ES-2 cells with increasing concentrations (inner curves set). Uptake values at 30 min was next plotted according to TH19P01-Alexa488 concentrations to calculate kinetic parameters using a one site-specific binding analysis with the GraphPad Prism Software (outer curve set). Results are expressed as normalized RFU according to measurements of control wells. Data represent the mean and SD (n = 3). (D) ES-2 ovarian cancer cells were incubated in the presence of TH19P01-Alexa488 (green) and LysotrackerTM (red). The cells were then washed and fixed, then nuclei stained with DAPI (blue). Photomicrographs were taken in separate channels for each of the fluorophores used and merged. Colocalized pixels are shown in yellow in the merged panels (n = 3). Magnification = 60×.

