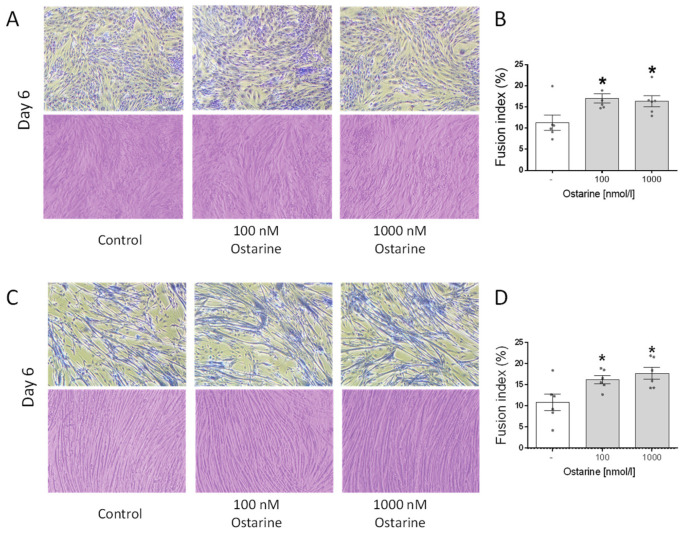
Figure 5.
Representative light microscopic pictures of cells showing changes in cell morphology and Jenner–Giemsa staining after ostarine treatment after 6 days of differentiation in L6 (A) and C2C12 (C) cells. Fusion index changes after ostarine treatment in L6 (B) and C2C12 (D) cells. Statistically significant differences are represented as * p < 0.05 versus corresponding control using one-way ANOVA followed by Dunnett’s post hoc test.

