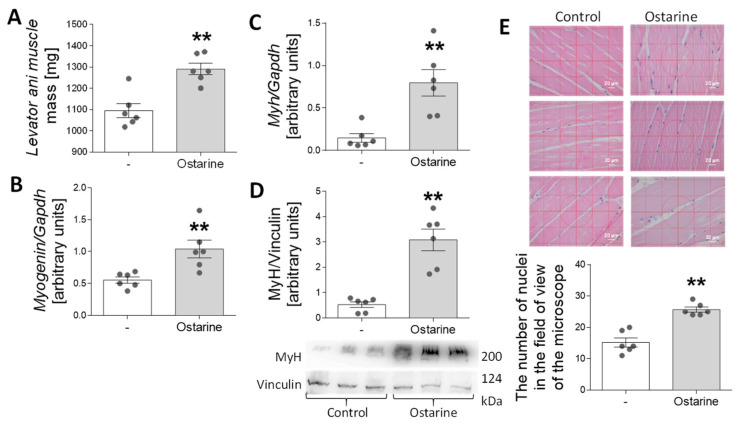
Figure 7.
Effect of 30-day ostarine treatment on (A) levator ani muscle mass, (B,C) mRNA expression of myogenin and myh, and (D) protein level of MyH. (E) Changes in number of nuclei in microscopic muscle sections. Statistically significant differences are represented as ** p < 0.01 versus control group using unpaired Student’s t-test (two-tailed distribution) or Mann–Whitney U test (n = 6 per group).

