. 2021 May 4;11(27):16252–16267. doi: 10.1039/d1ra00305d

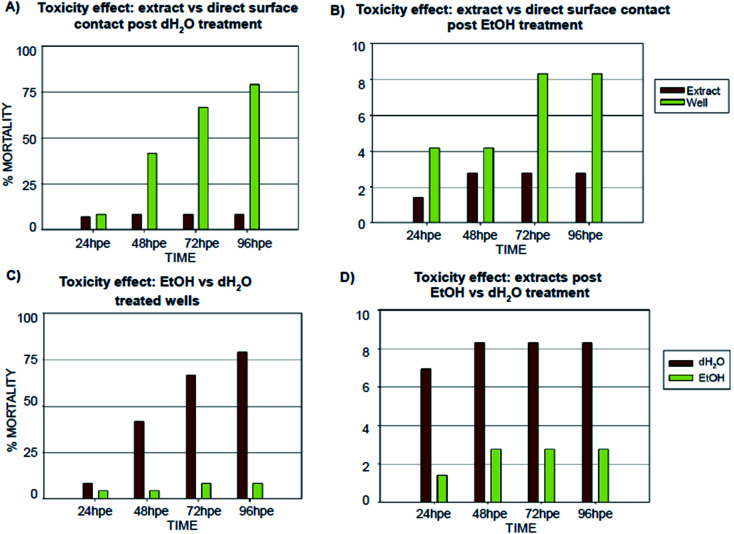
Fig. 5. Comparison of (specimen) post-treatments effects on embryonic development. Graphs show the results of the FET recorded in the 24, 48, 72, 96 hour time points, represented as percent mortality. (A) Comparison of FET results for embryos incubated in extract or directly on the polymer surface post dH2O treatment; (B) comparison of FET results for embryos incubated on the polymer surface post EtOH treatment; (C) toxicity comparison of surfaces treated by dH2O or EtOH; (D) toxicity comparison of extracts obtained by leaching of the dH2O and EtOH treated specimens. Note: absence of error bars means a single FET experiment with 24 embryos counted as individual replicates and 72 embryos per extract counted as individual replicates.

Fig. 5