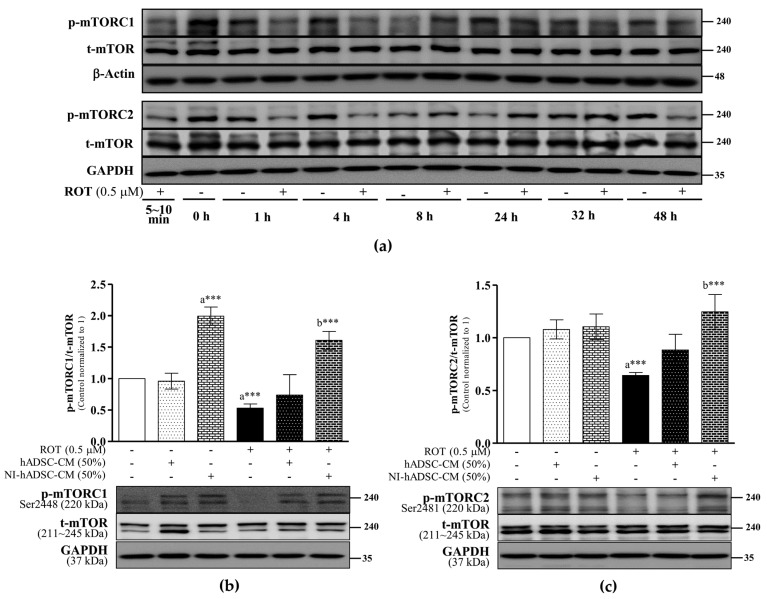
Figure 2.
Effect of NI-hADSC-CM on mTOR regulation. SH-SY5Y cells were treated for different timepoints with or without ROT (0.5 μM) and assessed by Western blotting (a). SH-SY5Y cells were incubated in the absence or presence of ROT (0.5 μM) for 48 h and treated with hADSC-CM or NI-hADSC-CM (at 50% dilution each) during the last 24 h. The ratios of p-mTORC1/t-mTOR (b) and p-mTORC2/t-mTOR (c) proteins were assessed using the Western blot assay. Original uncut Western blot images are shown in Supplementary Figure S3. Data are presented as the mean ± SEM of three independent experiments. Statistical analysis was performed using one-way analysis of variance followed by Tukey’s post hoc test. Statistical significance: a—compared with control; b—compared with ROT; *** p < 0.001. p-, phosphorylated; t-, total.

