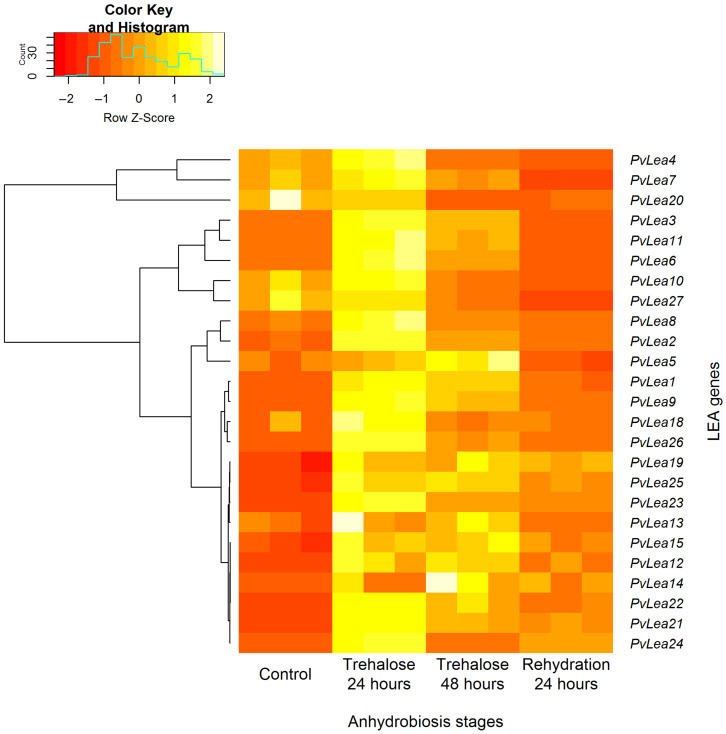
Figure 2.
Heat map of PvLea genes’ expression in Pv11 cells in control conditions and at different stages of anhydrobiosis induction caused by trehalose treatment. Experimental conditions are indicated at the bottom. Normalized expression values (reads per kilobase of exon per million mapped sequence reads, RPKM) were rescaled for each gene. The resulting values of relative expression for each gene are depicted as rows, with gene names indicated on the right. Color coding of relative expression is at the top of the image, with the brightest and darkest colors reflecting the highest and lowest expression for a given gene, respectively. The brackets on the left show the clusters identified based on the similarity of relative expression profiles.

