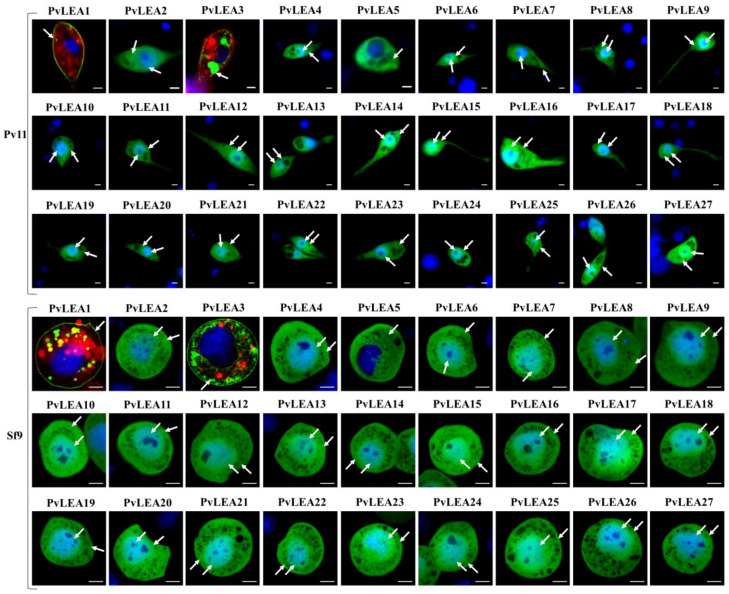
Figure 3.
Representative images of PvLEA proteins’ localization in Pv11 and Sf9 cells. (Pv11) Localization of PvLEA(x)–AcGFP1 chimeras in Pv11 cells: endoplasmic reticulum (ER) or Golgi apparatus (PvLEA22), membrane (PvLEA1), cytosol and nucleus (PvLEA4) and cytosol only (PvLEA5). (Sf9) Localization of PvLEA(x)–AcGFP1 chimeras in Sf9 cells: cytosol and nucleus (PvLEA8) and cytosol only (PvLEA6). PvLEA proteins are indicated above image panels, respective organelles are indicated by arrows. The scale bar is 2 µm for Pv11 cells and 5 µm for Sf9 cells. ER/Golgi localization in Pv11 cells was verified using ER/Golgi staining (see Methods, Section 2.4). Pv11 cells membranes and DNA in both cell cultures were stained with CellVue Claret Far Red (red) and Hoechst 33,258 (blue), respectively. Green color represents emission of a green fluorescent protein (AcGFP1) expressed in fusion with PvLEA protein. The following filters were used: excitation at 405 nm, emission at 410–508 nm (blue channel); excitation at 488 nm, emission at 490–633 nm (green channel); excitation at 633 nm, emission at 638–759 nm (red channel).

