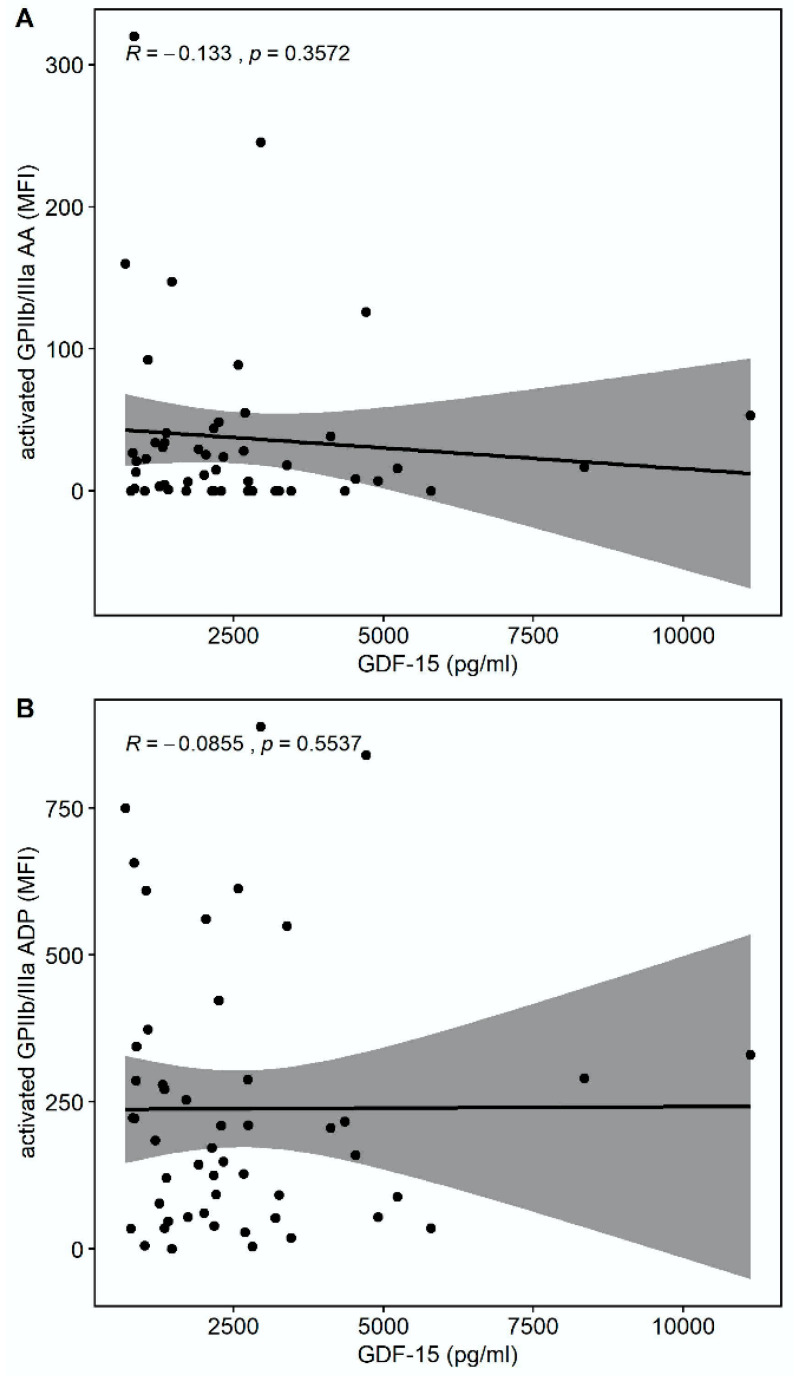
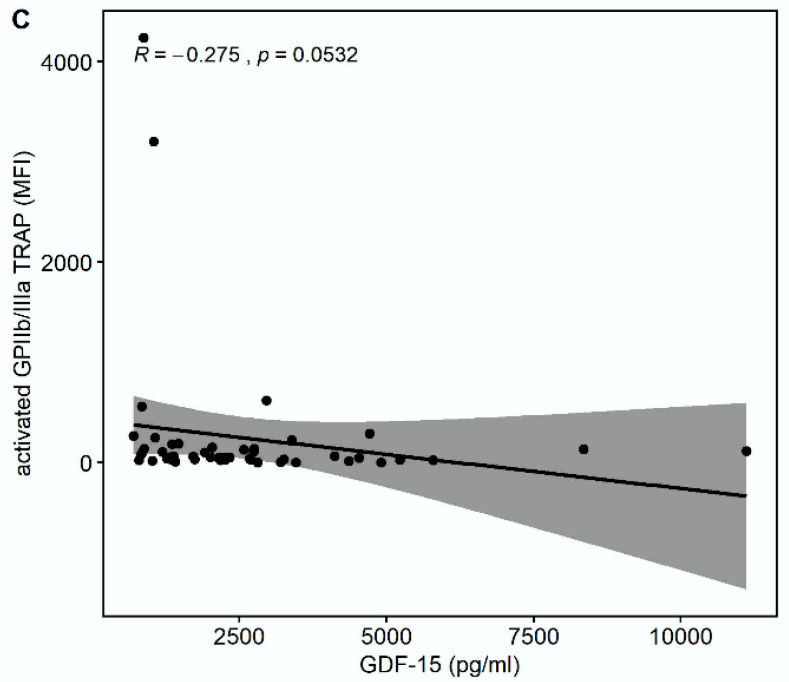
Figure 2.
Correlations of GDF-15 with the platelet surface expression of activated glycoprotein (GP) IIb/IIIa. (A) Scatter plot showing GDF-15 (x-axis) versus activated GPIIb/IIIa in response to arachidonic acid (AA) (y-axis). (B) Scatter plot showing GDF-15 (x-axis) versus activated GPIIb/IIIa in response to adenosine diphosphate (ADP) (y-axis). (C) Scatter plot showing GDF-15 (x-axis) versus activated GPIIb/IIIa in response to thrombin receptor-activating peptide (TRAP) (y-axis).


