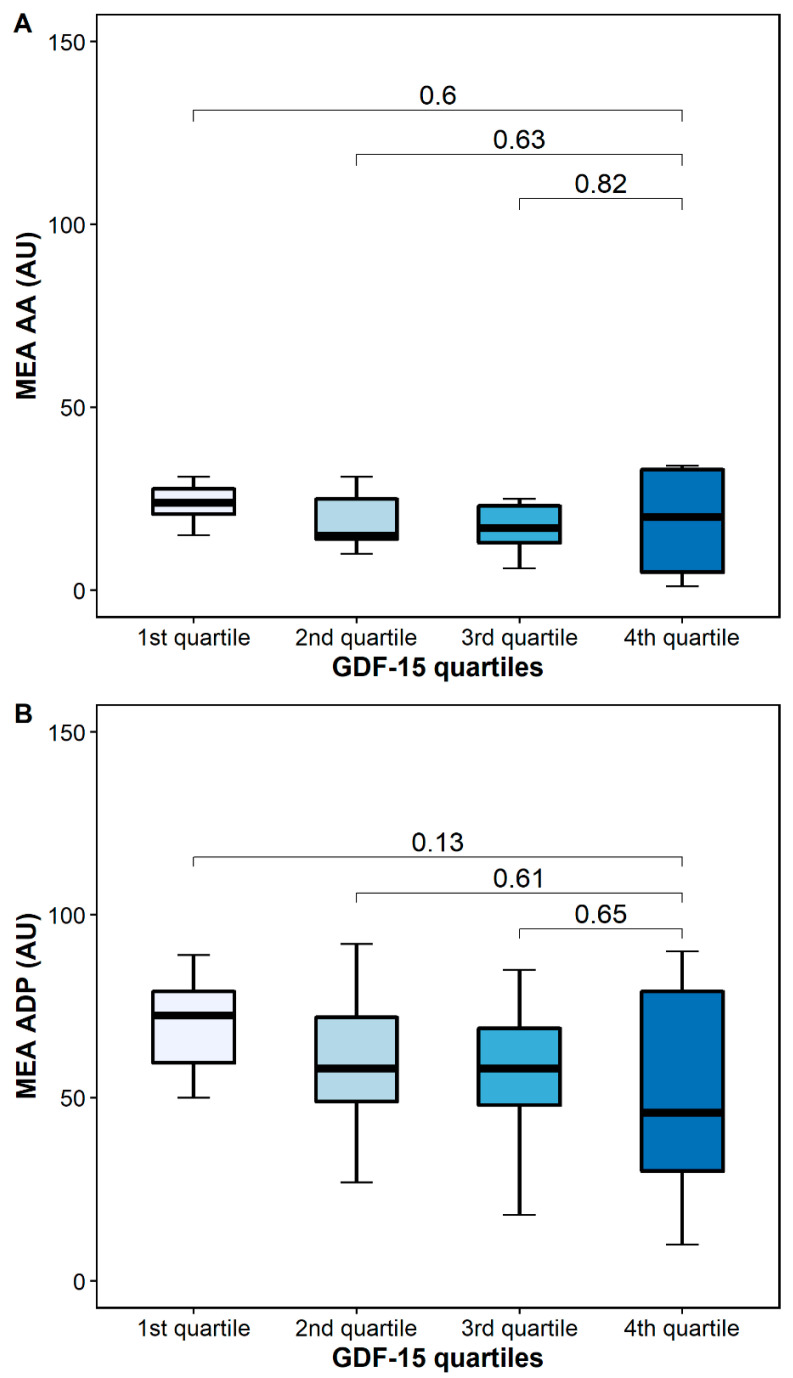
Figure 6.
Platelet aggregation by multiple electrode aggregometry (MEA) according to GDF-15 quartiles. (A) Arachidonic acid-inducible platelet aggregation by multiple electrode aggregometry. (B) Adenosine diphosphate (ADP)-inducible platelet aggregation by multiple electrode aggregometry. The boundaries of the box show the lower and upper quartiles of data, and the line inside the box represents the median. Whiskers were drawn from the edge of the box to the highest and lowest values that are outside the box but within 1.5 times the box length.

