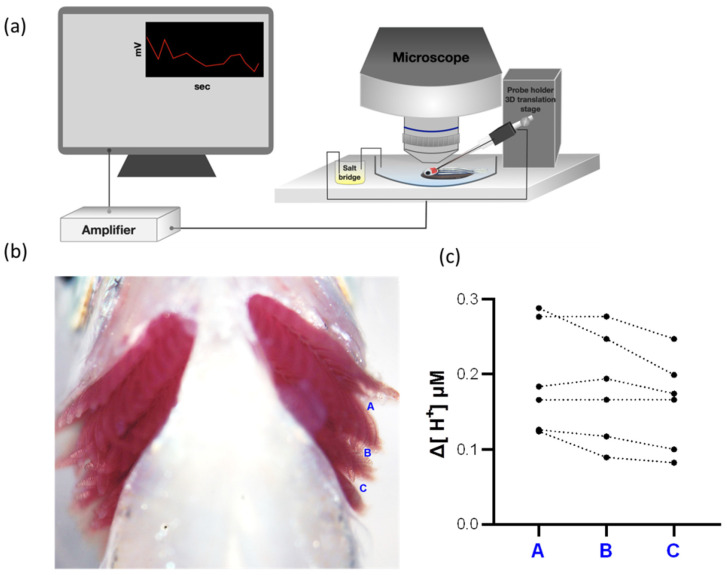
Figure 2.
H+ activities at different positions in the gills. The diagram of the scanning ion-selective electrode technique (SIET) device is shown (a). Three measured positions (A, B, and C) between each gill arch are shown in (b). The H+ gradients at different positions of the gills were measured by the SIET (N = 6) (c). The dotted line represents the same fish.

