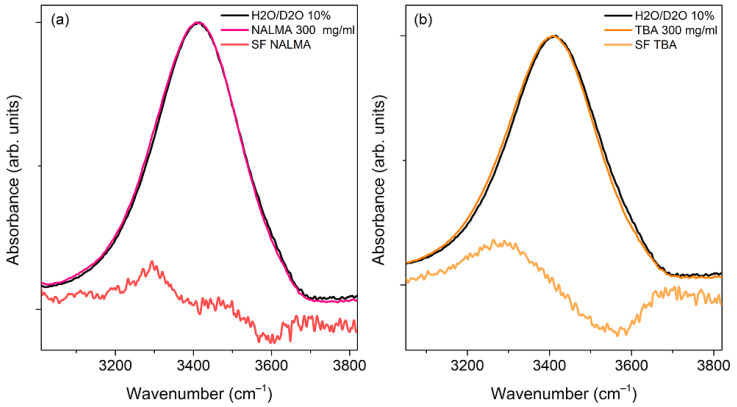
Figure 7.
(a) Normalized ATR-FTIR spectra of a NALMA solution (300 mg/mL) and its solvent (H2O/D2O 10% w/w), together with the resulting difference spectrum (DS). (b) Normalized ATR-FTIR spectra of a Tert-butyl alcohol (TBA) solution (300 mg/mL) and its solvent (H2O/D2O 10% w/w), together with the resulting difference spectrum (DS). In both panels, DS spectra have been multiplied by a factor of 5 for visualization purposes.

