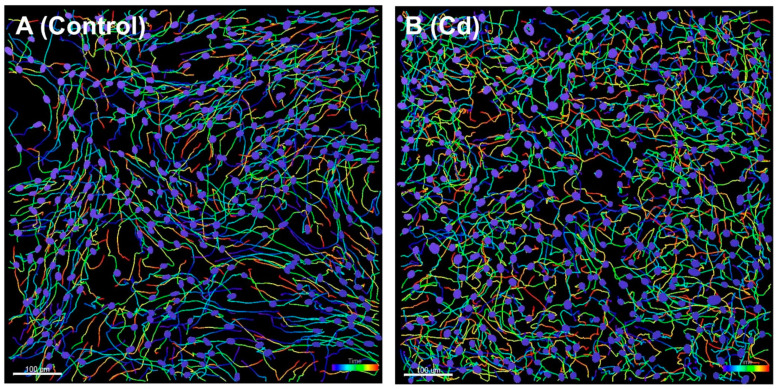
Figure 1.
Full track display of nuclear surface objects to illustrate migration patterns. The images were captured at time frame number 50 (at 245 min). (A). Ht-UtLM6 tracks showed relatively parallel bundles in multiple regions. (B). CR-LM6 tracks showed relatively random and disorganized patterns. Scale bar = 100 μm.

