Figure 2.
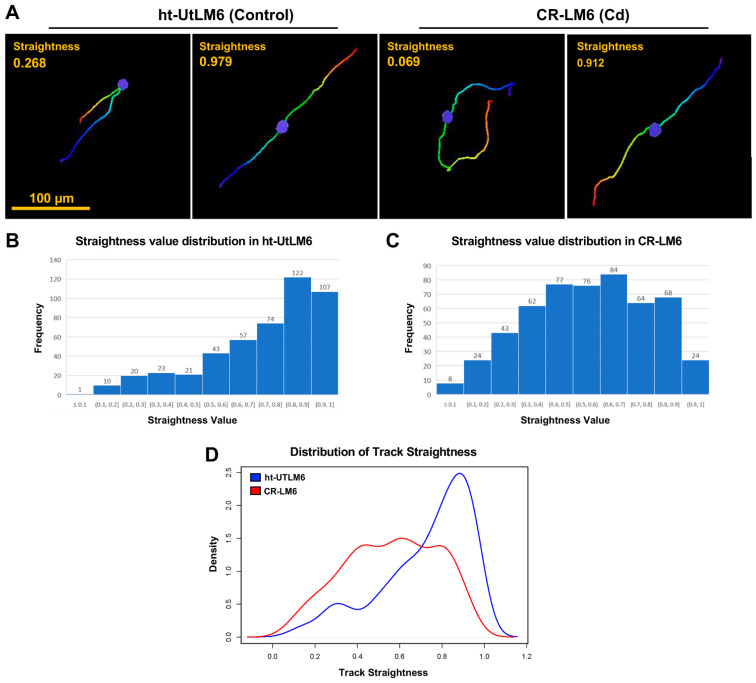
Distribution of Nuclear Track Straightness. (A) Tracks with various straightness values. These individual tracks were extracted from the full track displays in Figure 1. The Straightness is defined as the ratio between Track Displacement and Track Length. Scale bar = 100 μm. (B) Distribution of Track Straightness in ht-UtLM6. The data labels shown on top of the bars are the absolute counts. The Frequency in Y-axis denotes the number of counts within a specific bin. (C) Distribution of Track Straightness in CR-LM6. (D) Superimposed probability density function curves of Straightness values for both populations.

