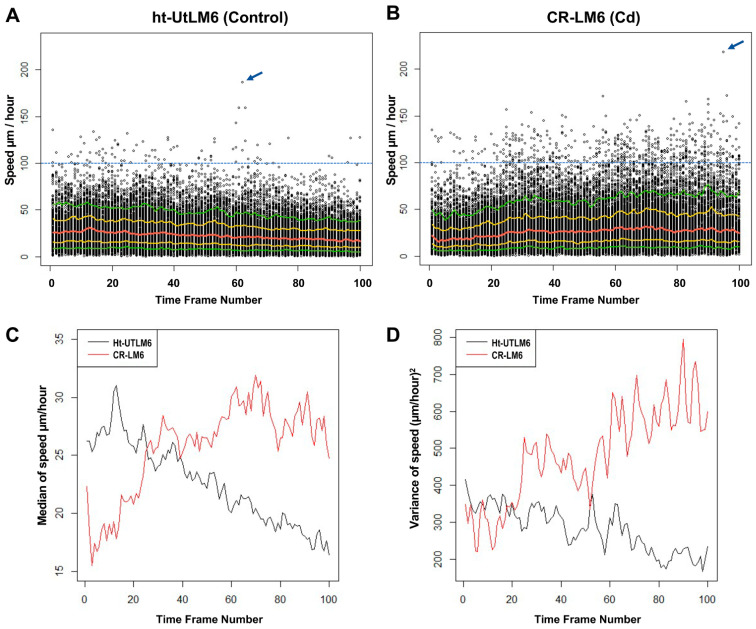
Figure 4.
Prolonged Cd exposure enhanced instantaneous speed and increased speed variance. The instantaneous speed values were plotted against time frame numbers 0, 20, 40, 60, 80 and 100, corresponding to imaging times (in minutes) of 0, 95, 195, 295, 395 and 495, respectively. The five colored curves correspond to median (red), 25% and 75% quantiles (gold) and 10% and 90% quantiles (green). The speed reads above the blue dashed lines are greater than 100 µm/hour. The highest speed reads are marked by blue arrows. (A) ht-UTLM6. (B) CR-LM6. (C) The medians of instantaneous speeds at each time point were plotted against frame numbers. (D) The variances of instantaneous speeds at each time point were plotted against frame numbers.

