Figure 5.
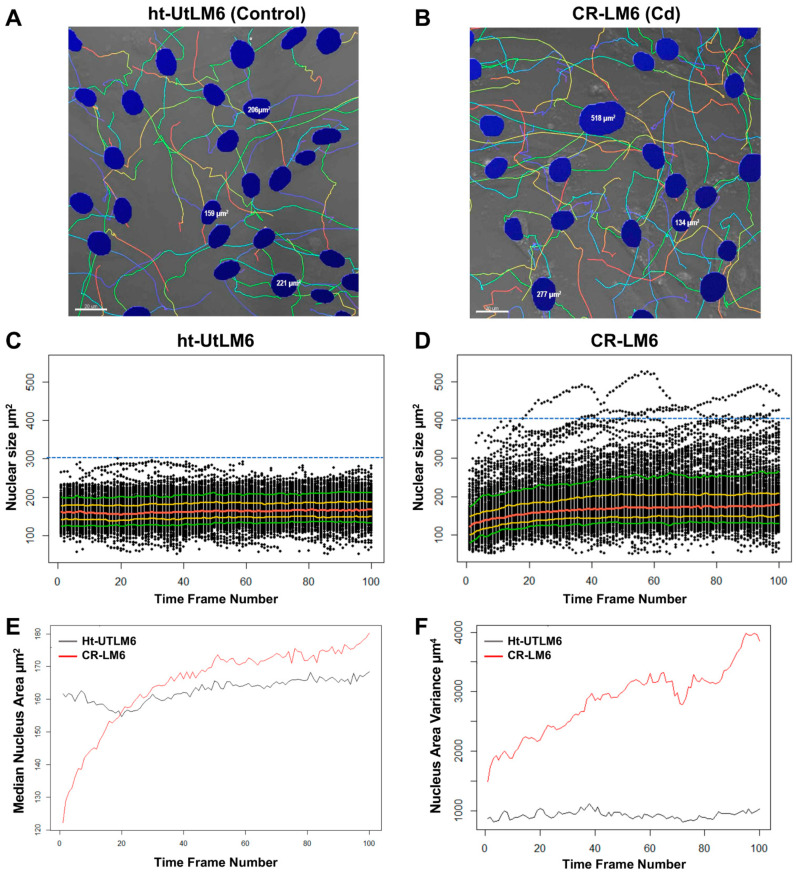
Cd exposure increased heterogeneity in nuclear size. The nuclear size, shape and migration tracks are shown. (A). ht-UTLM6. (B). CR-LM6. Scale bar = 20 μm. (C,D). Scatterplots to show the distribution of nuclear size over time. Note the presence of large nuclei on top of the plots. The five colored curves correspond with median (red), 25% and 75% quantiles (gold) and 10% and 90% quantiles (green). (C). ht-UtLM6. (D). CR-LM6. As shown by the blue dashed line, in ht-UtLM6 there was no nuclear objects with a size greater than 300 µm2, whereas in CR-LM6 there were 190 nuclear objects with a size greater than 400 µm2. (E). Medians of nuclear size at each time point were plotted against frame number. (F). Variances of nuclear size at each time point were plotted against frame number.

