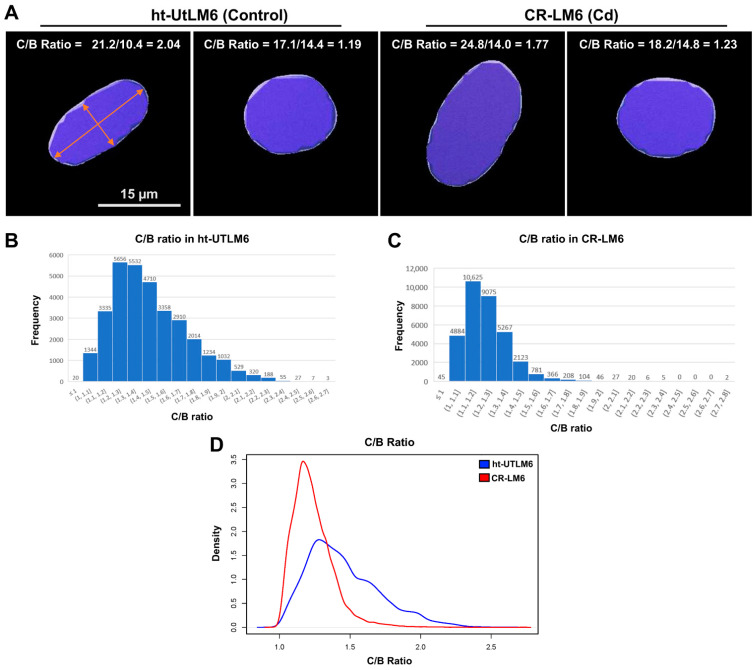
Figure 6.
Cd exposure induced rounding of nuclei. (A) Shapes of selected nuclei with various C/B ratios from ht-UTLM6 and CR-LM6 populations. The C/B ratio is defined as ratio between the length of the longest principal axis of a nucleus and the length of the second longest principal axis. Scale bar = 15 μm. (B) The distribution of C/B ratio in ht-UTLM6. The data labels shown on top of the bars are the absolute counts. (C) The distribution of C/B ratio in CR-LM6. (D) The overlay of inset B and inset C by probability density function. The x-axis is the C/B ratio and y-axis is probability density.

