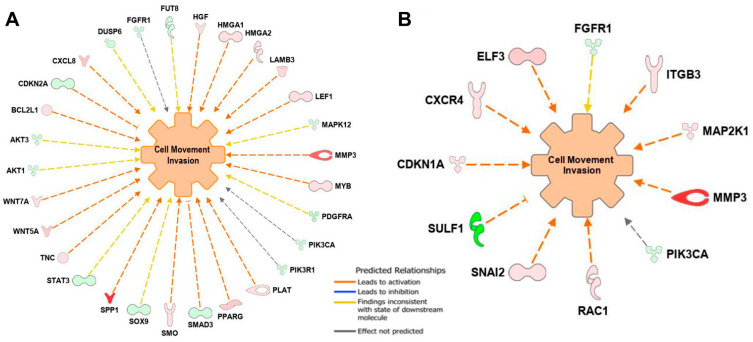
Figure 8.
IPA predicted that Cd exposure stimulated migration and invasion in CRLM6 cells based on the directions of the gene expression changes. (A). IPA function analysis derived from the PanCancer Pathways panel dataset (z-score 2.30). (B). IPA functions analysis derived from the PanCancer Progression panel dataset (z-score 2.35). The dashed lines with an arrow indicate that upregulation of gene expression is predicted to promote cell movement. The dashed lines with a T-bar demonstrate that downregulation of gene expression is predicted to promote cell movement.

