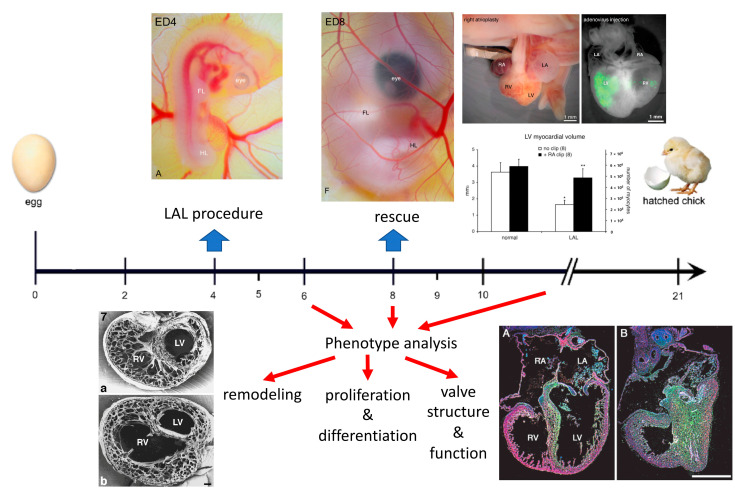
Figure 1.
Scheme of the workflow for creating the chick model of HLHS and examples of phenotypic findings (below the time axis in days) and rescue attempts (top right). From references [1,6,8,9,10]. The time axis shows embryonic days; the heart starts to beat before ED2, develops trabeculae at ED3, completes ventricular septation at ED8, and completes functional coronary vasculature by ED9. The panels above the axis show the appearance of the chick embryo at ED4 and ED8 [8], rescued ED9 heart with a silver microclip on the right atrium, green fluorescence protein expression in the embryonic left ventricle confirming successful injection of the adenovirus [1], and the graph shows the increased myocardial volumes in the right atrial clip rescue experiment [9]. The bottom panels show the phenotype on transverse sections in the scanning electron microscopy 48 h after ligation (left) [6], and decreased myocyte proliferation demonstrated by increased retention of radiolabeled [3H]-thymidine [10] (green grains over the hypoplastic left ventricle).

