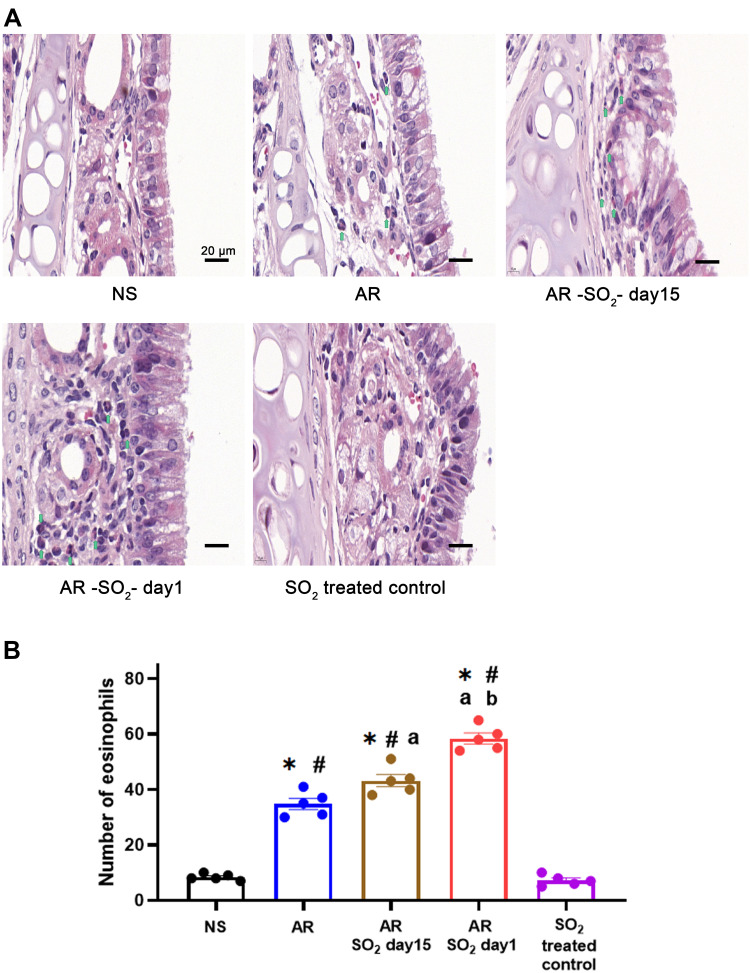
Figure 4.
Eosinophilic inflammation in nasal mucosa. (A) Representative images and (B) statistical histogram of eosinophil infiltration in nasal mucosa detected by HE staining. Green arrows indicate eosinophils. The AR group was sensitized with HDM challenge. The AR-SO2-day15 group and AR-SO2-day1 group included HDM-sensitized mice exposed to SO2 beginning on day 15 and day 1, respectively. The NS group was challenged with normal saline instead of HDM. The SO2-treated control group was challenged with normal saline and exposed to SO2 beginning on day 1. Scale bars = 20 μm. The data are presented as the mean ± SEM. *p < 0.05 vs the NS group. #p < 0.05 vs the SO2-treated control group. ap < 0.05 vs the AR group. bp < 0.05 vs the AR-SO2-day15 group.
Abbreviations: SO2, sulfur dioxide; HDM, house dust mite; NS, normal saline; AR, allergic rhinitis.

