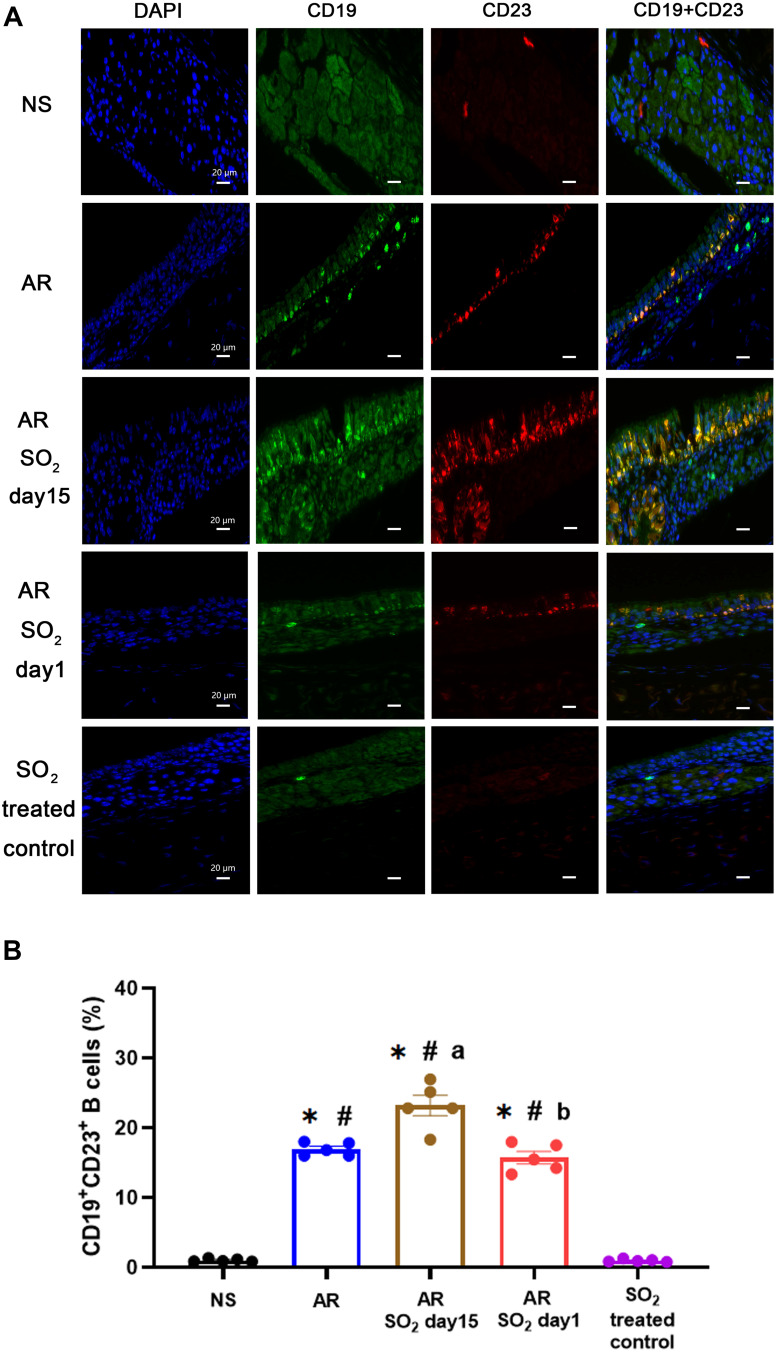
Figure 7.
Expression of CD23+ B cells in nasal mucosa. (A) Representative images of CD19+CD23+ expression in nasal mucosa detected by immunofluorescence staining (magnification 1000×). DAPI, the nuclear staining (blue). CD19, a specific marker for B lymphocytes (green). CD23, the low-affinity receptor for IgE (red). CD19+CD23+, double positive for CD19 and CD23 expression (yellow). Scale bars = 20 μm. (B) Statistical analysis of the percentages of CD19+CD23+ cells in the nasal mucosa. The AR group was sensitized with HDM challenge. The AR-SO2-day15 group and AR-SO2-day1 group included HDM-sensitized mice exposed to SO2 beginning on day 15 and day 1, respectively. The NS group was challenged with normal saline instead of HDM. The SO2-treated control group was challenged with normal saline and exposed to SO2 beginning on day 1. The data are presented as the mean ± SEM. *p < 0.05 vs the NS group. #p < 0.05 vs the SO2-treated control group. ap < 0.05 vs the AR group. bp < 0.05 vs the AR-SO2-day15 group.
Abbreviations: SO2, sulfur dioxide; NS, normal saline; AR, allergic rhinitis.

