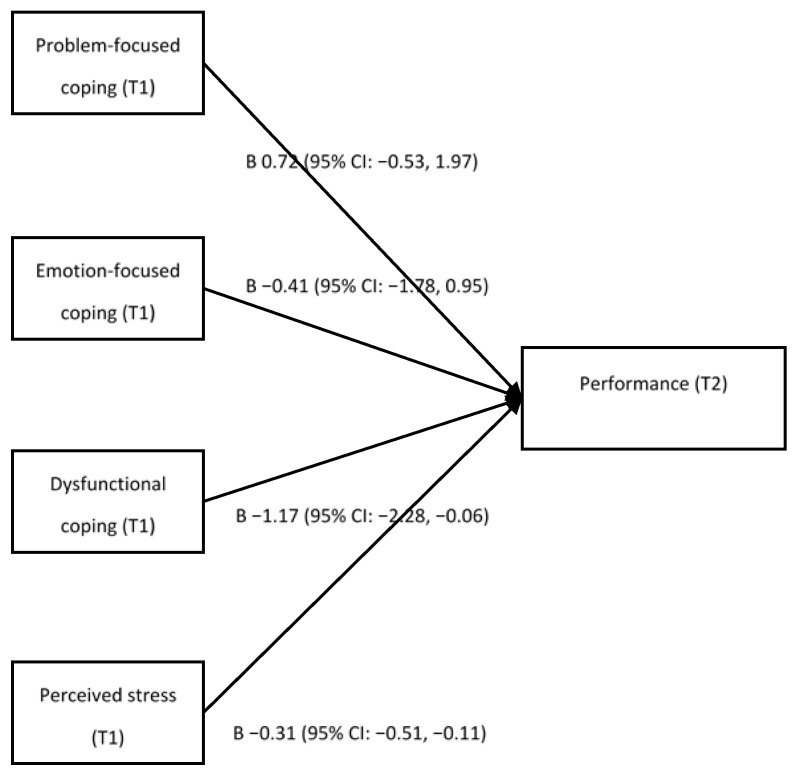
Figure 2.
Multivariate logistic regression results for the relationship between three coping subscales and work performance, where coefficients and 95% CI are shown, adjusted for work performance, age, company, employment form, employment status, shift work, overworking hours/month, actual rest days/month, alcohol status, smoking status, exercise habits, and sleep duration at baseline; CI = confidence interval.

