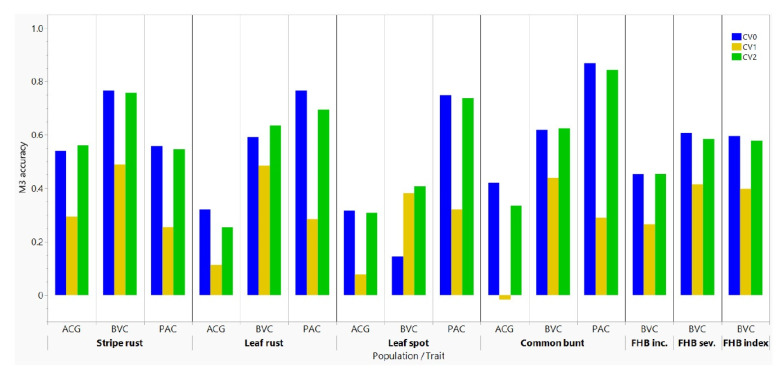
Figure 5.
Comparisons of average prediction accuracies using the M3 model with the CV0, CV1, and CV2 random cross-validation schemes that represent predicting the entire environment, the performance of newly developed lines, and sparse testing, respectively. See Table S5 for details.

