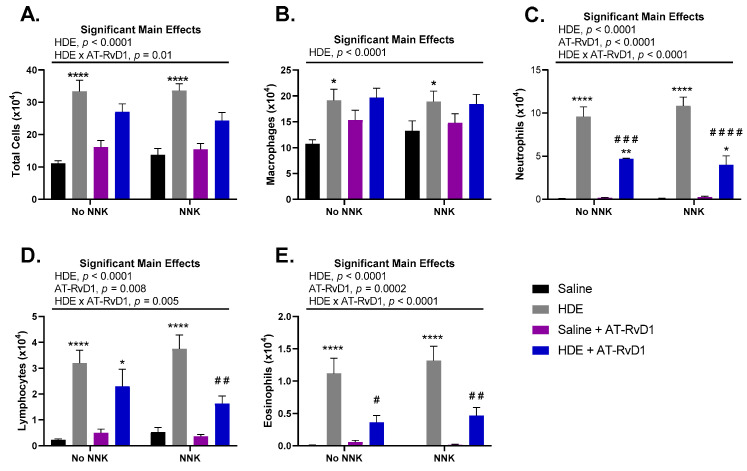
Figure 2.
Total and immune cell counts in A/J mice following chronic HDE exposure and AT-RvD1 treatment. Following 24 weeks of HDE exposure, mice were euthanized and bronchoalveolar lavage fluid was collected and assessed for total (A) macrophage (B), neutrophil (C), lymphocyte (D), and eosinophil (E) cell influx into the lung airways of the mice. Main significant effects and interactions are presented above each graph as depicted from three-way ANOVA analysis. The * symbol above the HDE bars represents the statistical post hoc comparisons between the HDE- and saline-treated conditions within each respective NNK-administration groups; (* p < 0.05; ** p < 0.01; **** p < 0.0001). Post hoc comparisons between HDE + AT-RvD1-exposed mice and their non-AT-RvD1-treated counterparts are depicted by the # symbol above each HDE + AT-RvD1 (control and NNK) bar; (# p < 0.05; ## p < 0.01; ### p < 0.001; #### p < 0.0001).

