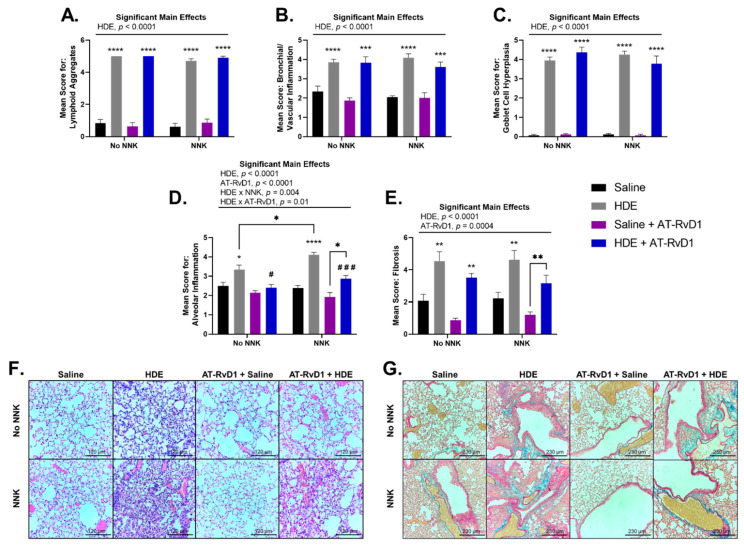
Figure 6.
Murine lung tissue histopathology and scoring following chronic HDE exposure and AT-RvD1 treatment. Left lung tissues of mice were sectioned and blindly scored for tissue pathogenesis including (A) lymphoid aggregates (B) bronchial/vascular inflammation (C) goblet cell hyperplasia (D) alveolar inflammation (E) fibrosis. Lung tissues were stained with H&E to visualize (F) alveolar inflammation (imaged at 20×) and Masson’s Trichrome for (G) tissue fibrosis (imaged at 10×). Scale bars are set at 120 µm for examination of alveolar inflammation (F) and 230 µm for tissue fibrosis (G). Significant main effects and interactions of HDE, NNK, and AT-RvD1 are shown above each histological scoring parameter. The * symbol above each of the HDE bars represents statistical significance in relation to their respective saline-exposed group; (* p < 0.05; ** p < 0.01; *** p < 0.001; **** p < 0.0001). Post hoc comparisons between HDE + AT-RvD1-exposed mice and their non-AT-RvD1-treated counterparts are depicted by the # symbol above each HDE + AT-RvD1 bar; (# p < 0.05; ### p < 0.001). Direct post hoc comparisons between HDE and saline AT-RvD1-treated mice are represented by the * symbol and lines connecting those graphs.

