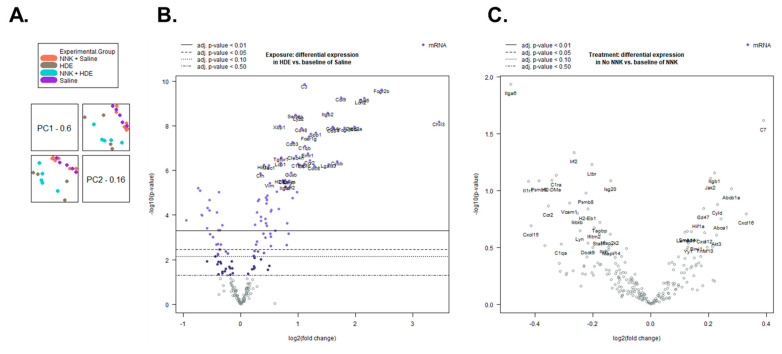
Figure 7.
Sample clustering and differential gene expression are driven by HDE exposure. (A) Principal component analysis shows a separation of sample association is determined by dust, not NNK exposure. (B) Volcano plot of differentially expressed genes between HDE- and saline-exposed mice following 24 weeks of exposure. (C) Volcano plot of differentially expressed genes between HDE- and HDE + NNK-exposed mice following 24 weeks of HDE exposure.

