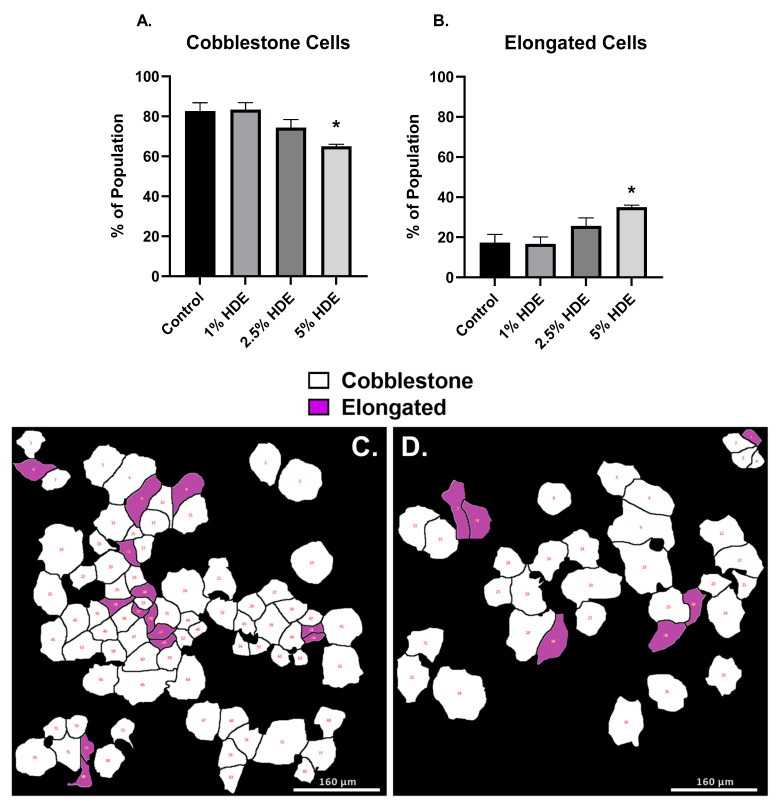
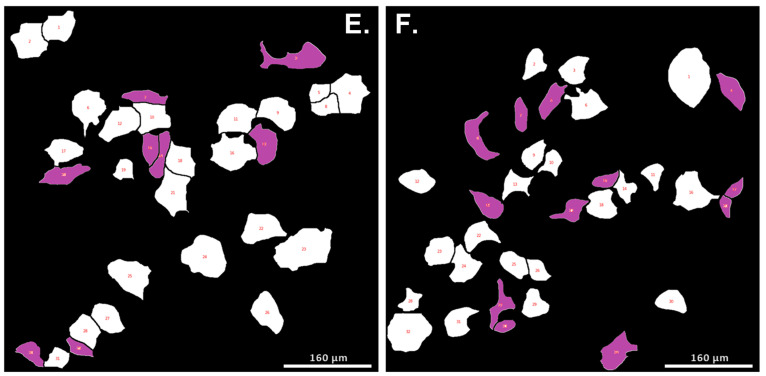
Figure 10.
A549 cell morphological changes 48 h after treatment with HDE. One-way ANOVA was performed to assess significance for cobblestone (A) or elongated (B) cell morphology counts following 48 h of treatment with HDE. Changes in cell phenotype was determined using bioinformatic image processing software in A549 cells treated with either the 0% HDE-control group (C), 1% HDE (D), 2.5% HDE (E), or 5% HDE (F); (* p < 0.05).


