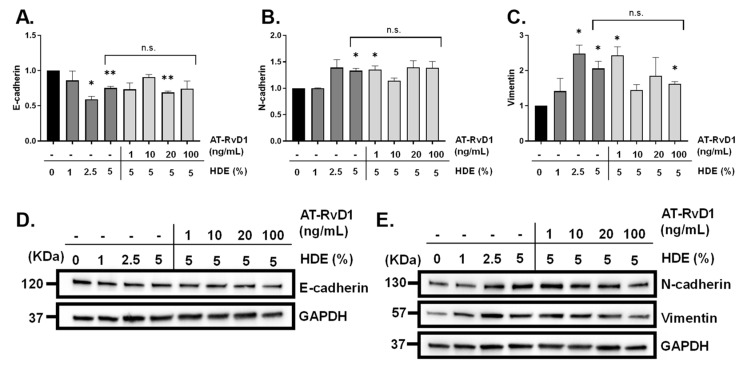
Figure 11.
Detection of EMT markers via western blot following A549 cell treatment with HDE and AT-RvD1. Changes in protein expression of the tight junction proteins (A,D) E-cadherin (120 KDa) and (B,E) N-cadherin (130 KDa), and mesenchymal cell marker (C,E) vimentin (57 KDa). One-sample t-tests were performed relative to the 0% HDE control groups; (* p < 0.05; ** p < 0.01). Uncropped blots of Figure 11 can be found in the Figure S6.

