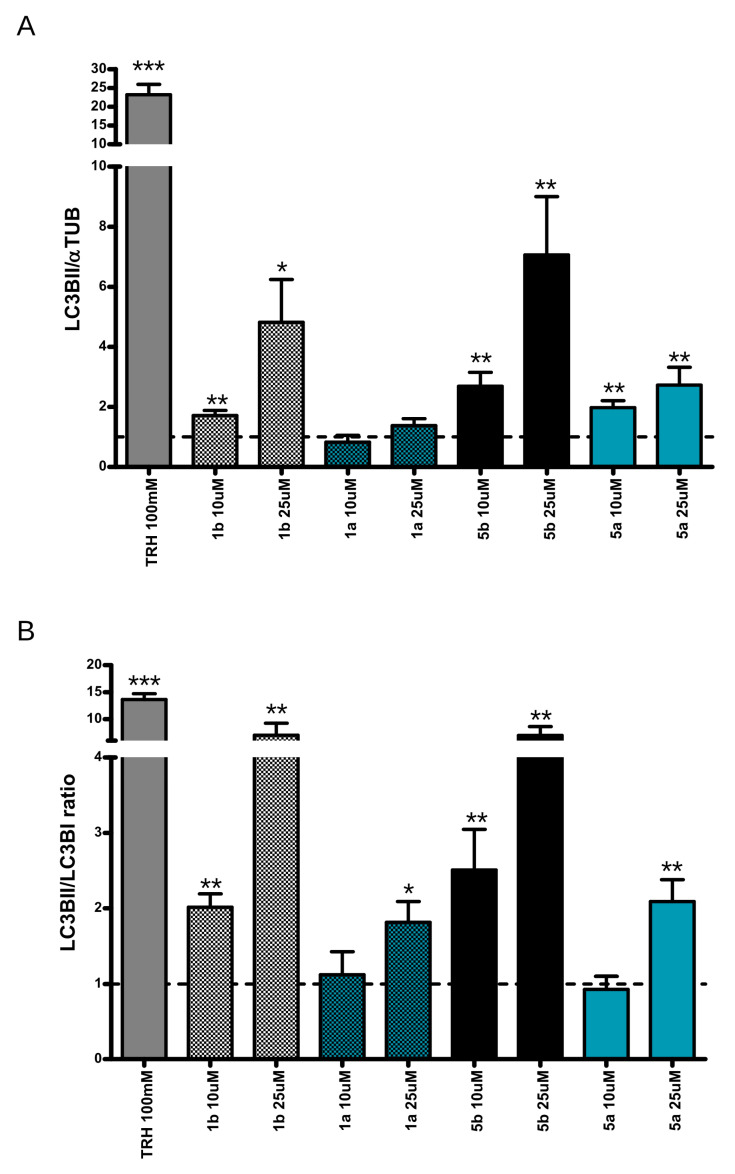
Figure 3.
Biological activity of trehalose, conjugates 1a and 1b and NAs 5a and 5b. Quantification of LC3BI, LC3BII and tubulin signals. (A) The graph shows LC3BII amount expressed as fold over α-tubulin. Data are expressed as mean ± S.E.; * < p < 0.05, ** p < 0.01 vs. control, n = 10–15. (B) The graph shows the LC3BII/LC3BI ratio. Each value was normalized on proper control. Data are expressed as mean ± S.E.; *** p < 0.001, ** p < 0.01, * p < 0.05 vs. control, n = 10–15.

