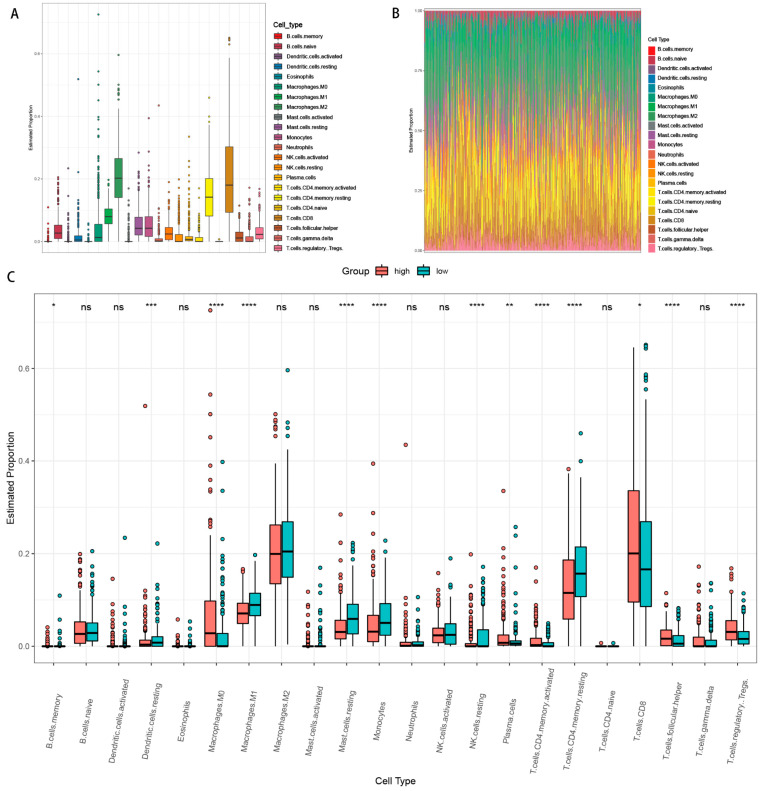
Figure 6.
Distribution of immune cells in tumor microenvironment in the TCGA cohort. (A) Each type of immune cell accounts for information in the tumor microenvironment. (B) The proportion of immune cells in each patient in the TCGA cohort. (C) The difference in the proportion of immune cells between the high-risk group and the low-wind group. *: p < 0.05; **: p < 0.01; ***: p < 0.001; ****: p < 0.0001; ns: no significance.

